Welcome to Our Latest Elliott Wave Analysis for Advanced Micro Devices Inc. (AMD)

This report delves into AMD's price action using Elliott Wave Theory, offering traders valuable insights into potential market opportunities. We'll analyze both the daily and 1-hour charts to provide a comprehensive view of AMD's current market behavior.

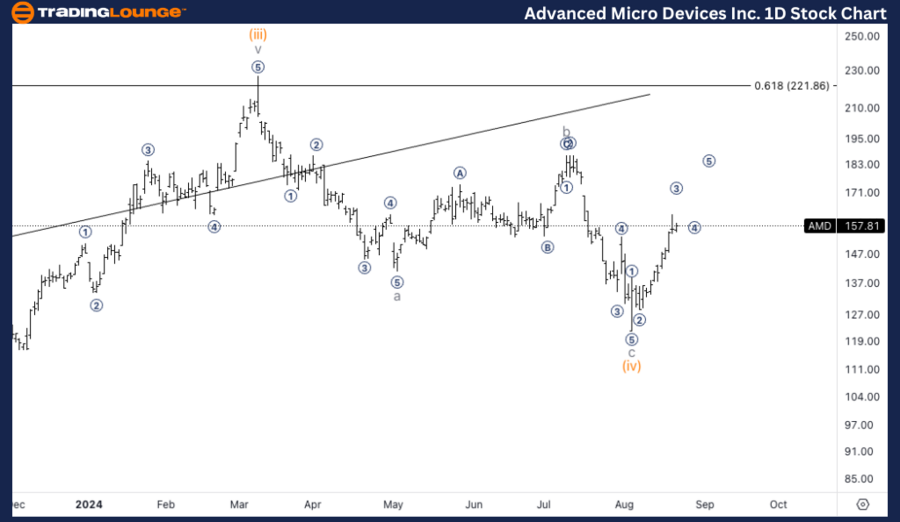
AMD Elliott Wave Analysis - Daily Chart

Advanced Micro Devices Inc. (AMD) Daily Chart Analysis

AMD Elliott Wave Technical Analysis

  • Function: Trend
  • Mode: Impulsive
  • Structure: Motive
  • Position: Wave (v)
  • Direction: Upside in wave (v)

Details: We are observing a three-wave move, potentially forming minuette wave (iv), with consistent support above $150.

AMD Stock Forecast – Daily Chart Overview

AMD appears to be advancing into wave (v), the final wave of the current impulsive sequence. Recent price movements indicate a three-wave correction likely forming minuette wave (iv). Crucially, AMD has consistently found support around the $150 level, reinforcing the possibility of continued upward momentum. The market structure suggests that wave (v) could extend further, with a potential target of $180 as this wave develops.

Advanced-Micro-Devic...


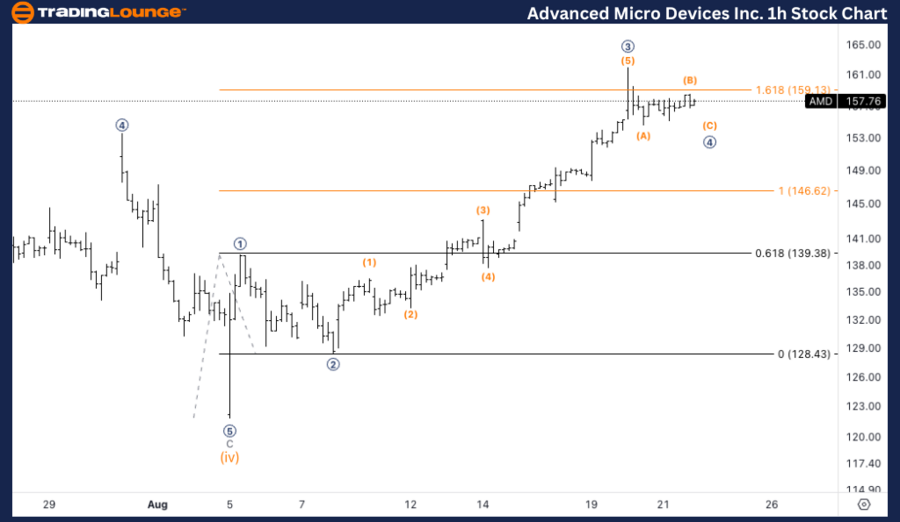
AMD Elliott Wave Analysis - 1H Chart

Advanced Micro Devices Inc. (AMD) 1H Chart Analysis

AMD Elliott Wave Technical Analysis

  • Function: Trend
  • Mode: Impulsive
  • Structure: Motive
  • Position: Microwave 4 of i
  • Direction: Upside into microwave 5

Details: We are monitoring the completion of micro wave 4, with the price reaching the 1.618 Fibonacci extension of wave 3 vs. 1 at $159. We anticipate a potential top in microwave 5 around $180.

Advanced Micro Devices Stock Analysis – 1H Chart Overview

AMD is nearing the completion of micro wave 4, having reached the 1.618 Fibonacci extension of wave 3 vs. 1 at $159. This level serves as significant resistance, yet the current wave structure suggests that microwave 5 could drive the price towards $180, the expected peak for this microwave sequence.

Technical Analyst: Alessio Barretta

Source: visit Tradinglounge.com and learn From the Experts Join TradingLounge Here 

See Previous: Palo Alto Networks Inc. Elliott Wave Technical Analysis

Special Trial Offer - 0.76 Cents a Day for 3 Months! Click here

Access 7 Analysts Over 200 Markets Covered. Chat Room With Support

Advanced-Micro-Devic...

Related

Nifty 50 Elliott Wave Bullish Impulse Wave 3 on Daily & Weekly – Watch Invalidation Level 24384, Await Wave 2 Pullback

Nifty 50 Elliott Wave Bullish Impulse Wave 3 on Daily & Weekly – Watch Invalidation Level 24384, Await Wave 2 Pullback

Elliott Wave analysis on Nifty 50 shows bullish impulsive Wave 3 in progress on daily and weekly cha...

Read More >
Euro/U.S.Dollar(EURUSD) Elliott Wave Technical Analysis 24 January 24

Euro/U.S.Dollar(EURUSD) Elliott Wave Technical Analysis 24 January 24

Euro and U.S. Dollar(EURUSD) Elliott Wave Technical Analysis for 24 January 24 with comprehensive An...

Read More >
VanEck Rare Earth & Strategic Metals ETF (REMX) Elliott Wave Forecast Predicts Rare Earth Metals Rally with $57 Target

VanEck Rare Earth & Strategic Metals ETF (REMX) Elliott Wave Forecast Predicts Rare Earth Metals Rally with $57 Target

VanEck REMX ETF is nearing the end of a corrective wave 4 and preparing for a bullish rally. Learn k...

Read More >
BLOCK INC (SQ2) ASX Elliott Wave Analysis: Stock Forecast, Breakout Targets, Invalidation Points, and Trading Strategies for Investors

BLOCK INC (SQ2) ASX Elliott Wave Analysis: Stock Forecast, Breakout Targets, Invalidation Points, and Trading Strategies for Investors

This analysis covers BLOCK INC (SQ2) Elliott Wave technical patterns, highlighting breakout targets,...

Read More >
NIFTY 50 INDEX Elliott Wave Technical Analysis: Indian Stock Market Outlook Progressing Toward the 25,000-25,100 Range

NIFTY 50 INDEX Elliott Wave Technical Analysis: Indian Stock Market Outlook Progressing Toward the 25,000-25,100 Range

The NIFTY 50 Index is currently in a corrective wave pattern, progressing toward the 25,000-25,100 r...

Read More >

$1 for 2 Weeks

then $29 a month!

What a Special Offer!

Trade Recommendations

Unleash the power of deversified trading with our comprehensive portfolio, covering 250+ markets:

  • Stock Trades
  • Crypto Trades
  • Forex Trades
  • Commodity Trades
Elliott Wave Analysis

Gain a competitive edge with expert insights and AI-powered Elliott Wave charting into:

  • Global Indices
  • US Stocks & ASX Stocks
  • Forex & Crypto
  • Commodities
Top-Notch Trading Tools

Equip yourself with the tools of success:

  • Real-time Chat rooms
  • Elliott Wave Algorithm
  • Portfolio tools
  • TradingLevels
  • Screener
  • Trading Game
7 Elliott Wave Analysts

Stay ahead of the market with daily charts and insightful videos
Your secret to strategic trading!

JOIN HERE


Welcome to TradingLounge (ASIC A.R.No. 321187), specialists in trades, trading education and technical analysis, covering stocks, indices, commodities, forex and cryptocurrencies.

When you join TradingLounge you have access to everything we offer, including trade tools, educational content and a social platform to chat with like-minded investors.

Read more

@Copyright 2024 by tradinglounge.com

Contact Us

Australian no: 02 4787 6020

International no: +61 (2) 47876020

Pay with:

Find us on