18Jul

Spotify (SPOT) U.S. Stocks Elliott Wave Technical Analysis shows Completion and Ending Diagonal Breakout — Potential Bullish Reversal

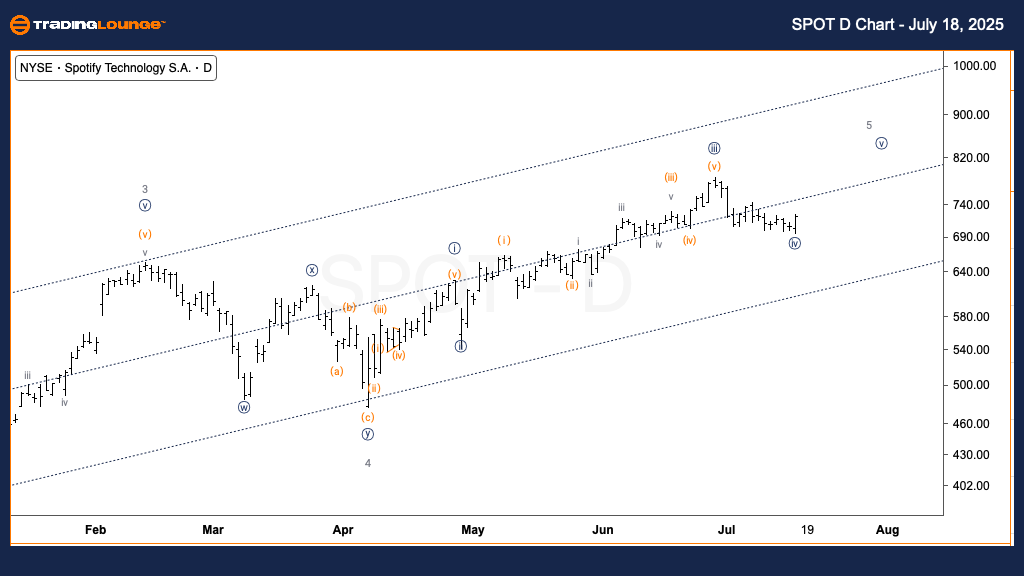
Spotify (SPOT) Elliott Wave Forecast | Trading Lounge Daily Chart

Spotify (SPOT) Daily Chart Analysis

SPOT Elliott Wave Technical Outlook

FUNCTION: Counter-Trend

MODE: Corrective

STRUCTURE: Flat Pattern

POSITION: Wave {iv} of 5

DIRECTION: Bottom formation likely in Wave {iv}

SPOT Daily Chart Technical Analysis:

Spotify (SPOT) shows signs of being in the final phase of a corrective flat pattern, currently forming Wave {iv} within the larger Wave 5 trend on the daily chart. Price movement is hovering near the mid-line of a temporary parallel trend channel, implying constrained downward momentum. This setup indicates that the correction is nearly over, paving the way for a potential bullish breakout and continuation into Wave 5. This analysis favors a shift toward upward price action, supporting long-term bullish sentiment in SPOT stock.

SPOT-Stock-D-Chart-1...


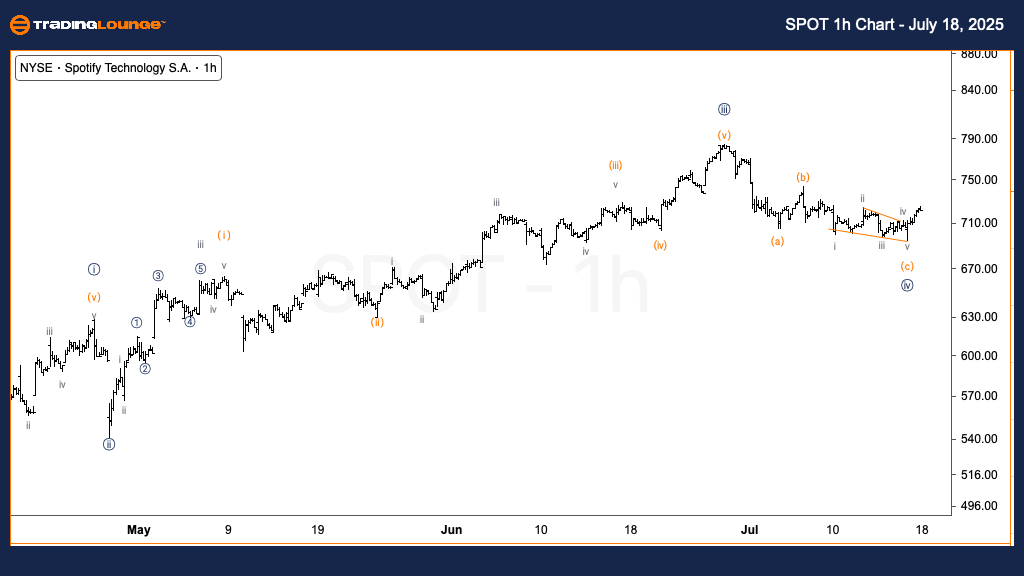
Spotify (SPOT) Elliott Wave Forecast | Trading Lounge 1-Hour Chart

SPOT Short-Term Elliott Wave Technical Outlook

FUNCTION: Counter-Trend

MODE: Corrective

STRUCTURE: Flat Pattern

POSITION: Wave (c) of {iv}

DIRECTION: Bottom formation expected in Wave {iv}

SPOT 1-Hour Chart Technical Analysis:

The 1-hour Elliott Wave chart of Spotify (SPOT) suggests a possible ending diagonal pattern developing within Wave (c) of {iv}. This pattern typically forms near the end of corrections, indicating a potential bullish reversal. A confirmed breakout above the diagonal resistance line would signal the completion of the corrective phase and the beginning of a new impulse wave toward the projected $800 level in Wave {v}. Traders should closely watch for breakout confirmation to align with the bullish forecast in SPOT stock price.

Technical Analyst: Alessio Barretta

Source: Visit Tradinglounge.com and learn from the Experts. Join TradingLounge Here 

See Previous: Advanced Micro Devices Inc. (AMD) Elliott Wave Technical Analysis

VALUE Offer - $1 for 2 Weeks then $29 a month!Click here

Access 7 Analysts Over 200 Markets Covered. Chat Room With Support

SPOT-Stock-1h-Chart-...

Related

U.S. Dollar / Swiss Franc (USDCHF) Elliott Wave Technical Analysis: Market Outlook & Trading Strategy for Forex Traders

U.S. Dollar / Swiss Franc (USDCHF) Elliott Wave Technical Analysis: Market Outlook & Trading Strategy for Forex Traders

USDCHF Elliott Wave analysis, covering the daily and 4-hour charts, explains the corrective wave str...

Read More >
ADANI PORTS & SEZ Indian Stocks Elliott Wave Forecast: Bullish Impulse Wave 3 with Key Support Level and Price Prediction Update

ADANI PORTS & SEZ Indian Stocks Elliott Wave Forecast: Bullish Impulse Wave 3 with Key Support Level and Price Prediction Update

This detailed Elliott Wave analysis highlights a bullish trend for Adani Ports & SEZ, focusing on wa...

Read More >
Comprehensive Soybeans Commodity Elliott Wave Technical Analysis and Soybean Prices future predictions

Comprehensive Soybeans Commodity Elliott Wave Technical Analysis and Soybean Prices future predictions

Dive into the detailed Elliott Wave analysis of soybean prices in our latest market report. Understa...

Read More >
Elliott Wave Trading Strategies for SP500, NASDAQ 100, Bitcoin & Leading Tech Stocks

Elliott Wave Trading Strategies for SP500, NASDAQ 100, Bitcoin & Leading Tech Stocks

This blog provides Elliott Wave analysis and trading strategies for SP500, NASDAQ 100, Bitcoin, and ...

Read More >
VeChain Elliott Wave Forecast: VETUSD Buy Zone, Wave III Potential, Risk Alert, and Price Prediction for Swing Traders

VeChain Elliott Wave Forecast: VETUSD Buy Zone, Wave III Potential, Risk Alert, and Price Prediction for Swing Traders

This post breaks down VeChain's (VETUSD) price movement using Elliott Wave analysis, highlights ...

Read More >
Swiss Market Index Elliott Wave Technical Analysis: Covering key Trading Strategies, Investment Insights, and Market Updates

Swiss Market Index Elliott Wave Technical Analysis: Covering key Trading Strategies, Investment Insights, and Market Updates

This comprehensive guide provides an in-depth Elliott Wave analysis of the Swiss Market Index (SMI ...

Read More >

$1 for 2 Weeks

then $29 a month!

What a Special Offer!

Trade Recommendations

Unleash the power of deversified trading with our comprehensive portfolio, covering 250+ markets:

  • Stock Trades
  • Crypto Trades
  • Forex Trades
  • Commodity Trades
Elliott Wave Analysis

Gain a competitive edge with expert insights and AI-powered Elliott Wave charting into:

  • Global Indices
  • US Stocks & ASX Stocks
  • Forex & Crypto
  • Commodities
Top-Notch Trading Tools

Equip yourself with the tools of success:

  • Real-time Chat rooms
  • Elliott Wave Algorithm
  • Portfolio tools
  • TradingLevels
  • Screener
  • Trading Game
7 Elliott Wave Analysts

Stay ahead of the market with daily charts and insightful videos
Your secret to strategic trading!

JOIN HERE


Welcome to TradingLounge (ASIC A.R.No. 321187), specialists in trades, trading education and technical analysis, covering stocks, indices, commodities, forex and cryptocurrencies.

When you join TradingLounge you have access to everything we offer, including trade tools, educational content and a social platform to chat with like-minded investors.

Read more

@Copyright 2024 by tradinglounge.com

Contact Us

Australian no: 02 4787 6020

International no: +61 (2) 47876020

Pay with:

Find us on