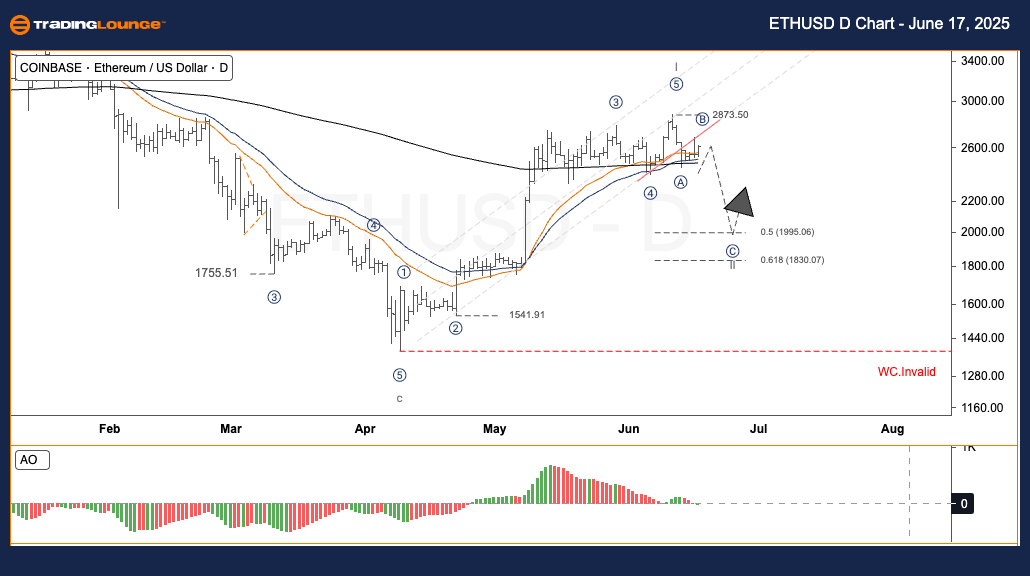
Ethereum (ETHUSD) Elliott Wave Daily Chart – ETHUSD Technical Outlook by TradingLounge
Function: Follow Trend
Mode: Motive
Structure: Impulse
Current Wave Position: Wave 2
Wave Cancel Invalid Level: Pending
Technical Overview:
Ethereum (ETH) recently pushed past the $2,800 resistance level, signaling a robust bullish impulse during Wave I. The current price retracement suggests a Wave II corrective pattern is forming. In line with Elliott Wave theory, if ETH holds above key Fibonacci retracement support levels and bullish sentiment strengthens, Wave III could trigger a significant upward move—often the most forceful wave in a motive structure.
ETHUSD Trading Strategy
- Short-Term Strategy (Swing Trade):
Entry Zone: Wave II correction offers potential accumulation opportunities. Monitor the $2,100 to $1,950 area for bullish reversal signs.
Invalidation Level: $1,385.76 – A move below this level invalidates the current Elliott Wave count and would call for a new analysis.
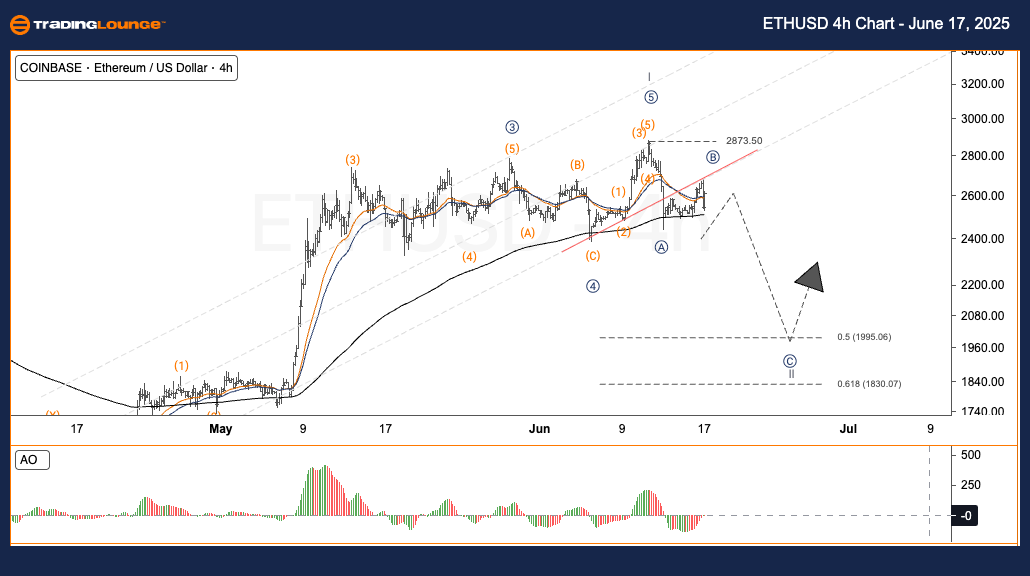
Ethereum (ETHUSD) Elliott Wave H4 Chart – ETHUSD Technical Outlook by TradingLounge
Function: Follow Trend
Mode: Motive
Structure: Impulse
Current Wave Position: Wave 2
Wave Cancel Invalid Level: Pending
Market Summary:
The H4 timeframe confirms the ongoing Wave II correction, consistent with the broader daily analysis. A sustained price above the $1,950–$2,100 range could validate a bullish Wave III scenario. This area remains critical for identifying trend reversal signals.