08May

Theta Token Price Prediction and Elliott Wave Analysis: THETAUSD Forecast, Trading Strategy, Key Levels, and Future Crypto Insights

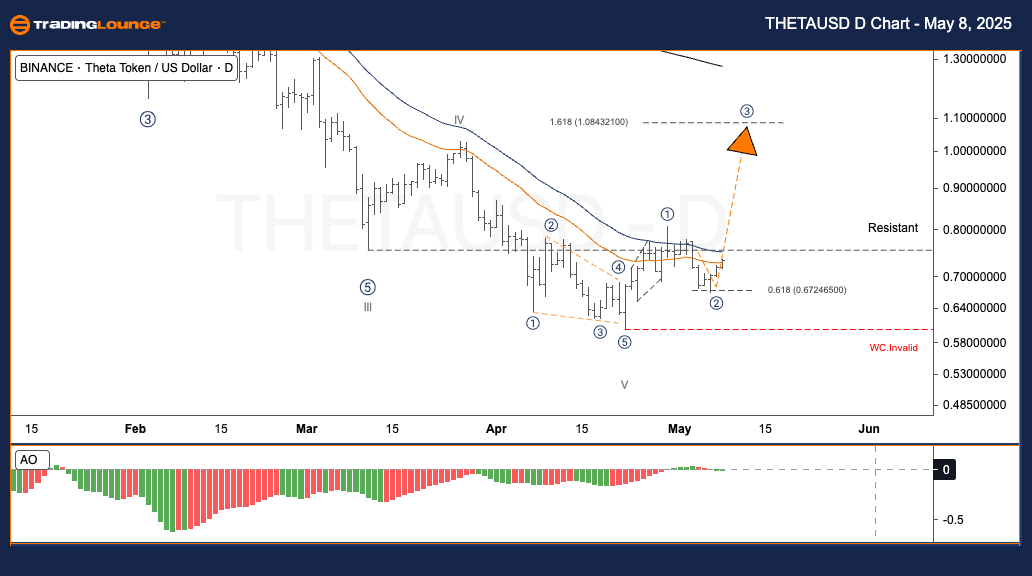
THETAUSD Elliott Wave Analysis TradingLounge Daily Chart

Theta Token / U.S. Dollar (THETAUSD) Day Chart Analysis

THETAUSD Elliott Wave Technical Analysis

Function: Following the trend

Mode: Motive

Structure: Impulse

Position: Wave 3

Direction Next Higher Degrees:

Wave Cancel Invalid Level:

Theta Token / U.S. Dollar (THETAUSD) Trading Strategy:

In early April, Theta Token (THETAUSD) completed wave V, establishing a strong support base. From there, it initiated a fresh upward trend with wave ①. Following the rally, the price entered a consolidation phase, retracing into the 61.8% Fibonacci support area during wave ②. A strong bounce from this key Fibonacci zone now points to the possible development of a powerful wave ③.

Trading Strategies:

Strategy

Approach

For short-term traders (Swing Trade):

If the price confirms a bullish reversal above $0.74 alongside rising volume, traders may consider entering long positions targeting wave ③.

Risk Management:

Wave Cancellation (W.C.) Invalid:
A price decline below $0.60 would invalidate the bullish wave structure, signaling a need to reassess the trade setup.

THETAUSD-Day-Crypto-...


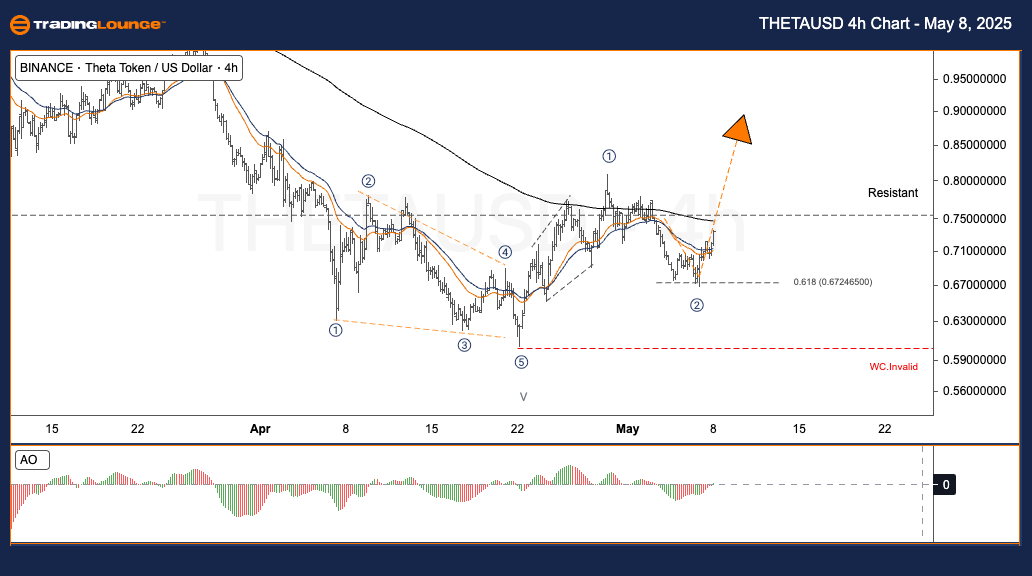
THETAUSD Elliott Wave Analysis TradingLounge H4 Chart

Theta Token / U.S. Dollar (THETAUSD) 4-Hour Chart Analysis

THETAUSD Elliott Wave Technical Analysis

Function: Following the trend

Mode: Motive

Structure: Impulse

Position: Wave 3

Direction Next Higher Degrees:

Wave Cancel Invalid Level:

Theta Token / U.S. Dollar (THETAUSD) Trading Strategy:

During early April, Theta Token (THETAUSD) formed a strong base by completing wave V. This confirmed the start of a new bullish cycle with wave ①. Since then, THETA entered a corrective phase within wave ②, reaching the 61.8% Fibonacci retracement zone. The sharp rebound suggests the potential early formation of a dynamic wave ③.

Trading Strategies:

Strategy

Approach

For short-term traders (Swing Trade):

Upon confirmation of a breakout above $0.74 with increasing trading volume, traders are advised to consider long entries, positioning for the expected wave ③ rally.

Risk Management:

Wave Cancellation (W.C.) Invalid:
Should the price fall below $0.60, the current Elliott Wave structure would be invalid, requiring strategy revision.

Technical Analyst: Kittiampon Somboonsod, CEWA

Source: Visit Tradinglounge.com and learn from the Experts. Join TradingLounge Here 

Previous: ADAUSD Elliott Wave Technical Analysis

VALUE Offer - Buy 1 Month & Get 3 Months!Click here

Access 7 Analysts Over 200 Markets Covered. Chat Room With Support

THETAUSD-4h-Crypto-C...

Related

Insights on Berkshire Hathaway Inc Stock Trends and Forecasts: BRK.B Stocks Elliott Wave Technical Analysis

Insights on Berkshire Hathaway Inc Stock Trends and Forecasts: BRK.B Stocks Elliott Wave Technical Analysis

This article delves into the Elliott Wave analysis of Berkshire Hathaway Inc. (BRK.B), focusing on d...

Read More >
Elliott Wave Analysis: S&P 500, NASDAQ 100, DAX 40, FTSE 100, ASX200 Trading Strategies

Elliott Wave Analysis: S&P 500, NASDAQ 100, DAX 40, FTSE 100, ASX200 Trading Strategies

Elliott Wave Analysis indicates a 'Risk On' sentiment for ASX 200, DAX 40, and FTSE 100. The...

Read More >
Insurance Australia Group Limited Trading Strategy & Market Trends: IAG Stock Analysis & Elliott Wave Technical Forecast

Insurance Australia Group Limited Trading Strategy & Market Trends: IAG Stock Analysis & Elliott Wave Technical Forecast

This article provides an in-depth Elliott Wave analysis for ASX: IAG (Insurance Australia Group Limi...

Read More >
Insights for Traders on ChainLink's Price Movement, Trading Strategies and Technical Indicators: LINKUSD Elliott Wave Analysis

Insights for Traders on ChainLink's Price Movement, Trading Strategies and Technical Indicators: LINKUSD Elliott Wave Analysis

This detailed analysis covers ChainLink (LINKUSD) price prediction using Elliott Wave theory, focusi...

Read More >
VAS Stock Analysis & Elliott Wave Technical Forecas: Vanguard Australian Shares Index ETF (V300AEQ) UNITS

VAS Stock Analysis & Elliott Wave Technical Forecas: Vanguard Australian Shares Index ETF (V300AEQ) UNITS

This article provides an in-depth Elliott Wave analysis of the ASX V300AEQ ETF (VAS), highlighting k...

Read More >
Elliott Wave analysis for Meta Platforms Inc. (META) Stock, Covering both Daily and 4-hour charts Technical Analysis

Elliott Wave analysis for Meta Platforms Inc. (META) Stock, Covering both Daily and 4-hour charts Technical Analysis

This article provides a detailed Elliott Wave analysis for Meta Platforms Inc. (META), covering both...

Read More >

$1 for 2 Weeks

then $29 a month!

What a Special Offer!

Trade Recommendations

Unleash the power of deversified trading with our comprehensive portfolio, covering 250+ markets:

  • Stock Trades
  • Crypto Trades
  • Forex Trades
  • Commodity Trades
Elliott Wave Analysis

Gain a competitive edge with expert insights and AI-powered Elliott Wave charting into:

  • Global Indices
  • US Stocks & ASX Stocks
  • Forex & Crypto
  • Commodities
Top-Notch Trading Tools

Equip yourself with the tools of success:

  • Real-time Chat rooms
  • Elliott Wave Algorithm
  • Portfolio tools
  • TradingLevels
  • Screener
  • Trading Game
7 Elliott Wave Analysts

Stay ahead of the market with daily charts and insightful videos
Your secret to strategic trading!

JOIN HERE


Welcome to TradingLounge (ASIC A.R.No. 321187), specialists in trades, trading education and technical analysis, covering stocks, indices, commodities, forex and cryptocurrencies.

When you join TradingLounge you have access to everything we offer, including trade tools, educational content and a social platform to chat with like-minded investors.

Read more

@Copyright 2024 by tradinglounge.com

Contact Us

Australian no: 02 4787 6020

International no: +61 (2) 47876020

Pay with:

Find us on