ASX: SOUTH32 LIMITED – S32 Elliott Wave Analysis TradingLounge 1D Chart

Overview of ASX: SOUTH32 LIMITED – S32 1D Chart (Semilog Scale) Analysis

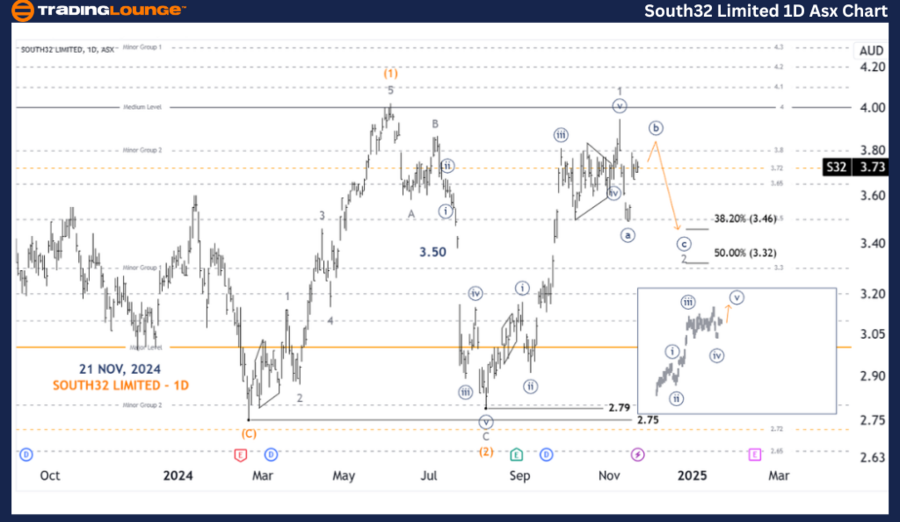
Our Elliott Wave analysis today provides an updated perspective on ASX: SOUTH32 LIMITED (ASX:S32). Based on our observations, the stock is likely to experience a pullback in the near term, corresponding to wave 2-grey, before a potential surge higher with wave 3-grey.

ASX: SOUTH32 LIMITED Elliott Wave Analysis

Key Features:

Function: Major trend (Minor degree, grey)

Mode: Motive

Structure: Impulse

Position: Wave ((a))-navy of Wave 2-grey

Detailed Insights:

  • Wave Progression: The completion of wave 1-grey suggests the onset of wave 2-grey, which may push prices lower. Retracement targets for wave 2-grey are projected within the range of 3.46 to 3.32. Following this correction, wave 3-grey is expected to lead a significant upward push.
  • Alternative Scenario: If the price continues rising instead of retracing, it may indicate that wave ((v))-navy is unfolding. However, the eventual result remains consistent with a pullback in wave 2-grey.
  • Invalidation Point: A drop below 2.79 will invalidate the current wave count.
SOUTH32-LIMITED-1D-A...


ASX: SOUTH32 LIMITED – S32 4-Hour Chart Analysis

Key Features:

Function: Major trend (Minor degree, grey)

Mode: Motive

Structure: Diagonal

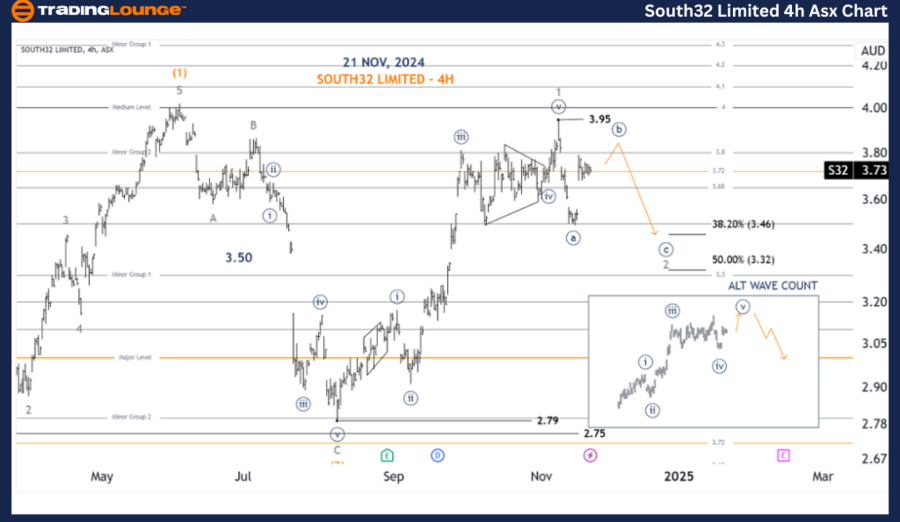
Position: Wave ((b))-navy of Wave 2-grey

Detailed Insights:

  • Alignment with 1D Chart: The 4-hour chart aligns closely with the 1D chart. A rise above 3.95 could confirm the activation of wave ((v))-navy under the alternative wave scenario.
  • Expected Completion: Upon reaching this scenario, wave 2-grey pullback remains the ultimate expectation.
  • Invalidation Point: A breach below 2.79 invalidates this analysis.

Technical Analyst: Hua (Shane) Cuong, CEWA-M (Master’s Designation).

Source: visit Tradinglounge.com and learn From the Experts Join TradingLounge Here 

See Previous: SUNCORP GROUP LIMITED Elliott Wave Technical Analysis

VALUE Offer - Buy 1 Month & Get 3 Months!Click here

Access 7 Analysts Over 200 Markets Covered. Chat Room With Support
SOUTH32-LIMITED-4h-A...


Conclusion:

Our Elliott Wave analysis for ASX: SOUTH32 LIMITED (ASX:S32) provides actionable insights into current and upcoming market trends. Key retracement and invalidation levels such as 3.46 - 3.32 and 2.79 guide traders in assessing wave count accuracy and refining trading strategies. Whether adhering to the primary or alternative scenarios, we anticipate a pullback before a stronger upward trend resumes, ensuring a well-informed approach to this market.

Related

Focusing on the stock's current ASX Trading Success: FORTESCUE LTD - FMG Stock Analysis & Elliott Wave Technical Forecast

Focusing on the stock's current ASX Trading Success: FORTESCUE LTD - FMG Stock Analysis & Elliott Wave Technical Forecast

This article provides a detailed Elliott Wave analysis of Fortescue Metals Group Ltd (FMG), focusing...

Read More >
DOGEUSD Elliott Wave Technical Analysis TradingLounge Daily Chart, 12 October 23

DOGEUSD Elliott Wave Technical Analysis TradingLounge Daily Chart, 12 October 23

DOGEUSD Elliott Wave TradingLounge Technical Analysis - DOGEUSD Elliott Wave Analysis Daily Chart, E...

Read More >
USD/CAD Elliott Wave Analysis: Trading Insights on 4-Hour and Daily Charts - 9 February 24

USD/CAD Elliott Wave Analysis: Trading Insights on 4-Hour and Daily Charts - 9 February 24

Dated 9 February 24, our "USD/CAD Elliott Wave Analysis Trading Lounge 4 Hour Chart" sugge...

Read More >
National Australia Bank Limited Stock Analysis - NAB Elliott Wave Technical Forecast and Trading Strategies

National Australia Bank Limited Stock Analysis - NAB Elliott Wave Technical Forecast and Trading Strategies

This article provides an in-depth Elliott Wave analysis of NAB (National Australia Bank) stock on th...

Read More >
Bitcoin/U.S. dollar(BTCUSD) Elliott Wave Technical Analysis 31 October 23

Bitcoin/U.S. dollar(BTCUSD) Elliott Wave Technical Analysis 31 October 23

Bitcoin/U.S. dollar(BTCUSD) Elliott Wave Technical Analysis on 31 October 23 with BTCUSD Analysis Da...

Read More >
Saudi Arabian Market is Showing Strong Bullish Trends according to TASI Index Elliott Wave Technical Analysis

Saudi Arabian Market is Showing Strong Bullish Trends according to TASI Index Elliott Wave Technical Analysis

The TASI Index is showing strong bullish trends according to Elliott Wave analysis on both daily and...

Read More >

Buy 1 Month

Get 3 Months!

Special Offer:

Trade Recommendations

Unleash the power of deversified trading with our comprehensive portfolio, covering:

  • Stock Trades
  • Crypto Trades
  • Forex Trades
  • Commodity Trades
Elliott Wave Analysis

Gain a competive edge with expert insights in to:

  • Global Indices
  • US Stocks & ASX Stocks
  • Forex & Crypto
  • Commodities
Top-Notch Trading Tools

Equip yourself with the tools of success:

  • Social Chat
  • Elliott Wave Algorithm
  • Screener
  • TradingLevels
  • Trading Game
7 Elliott Wave Analysts

Stay ahead of the market with daily charts and insightful videos
-Your secret to strategic trading!

JOIN HERE


Welcome to TradingLounge (ASIC A.R.No. 321187), specialists in trades, trading education and technical analysis, covering stocks, indices, commodities, forex and cryptocurrencies.

When you join TradingLounge you have access to everything we offer, including trade tools, educational content and a social platform to chat with like-minded investors.

Read more

@Copyright 2024 by tradinglounge.com

Contact Us

Australian no: 02 4787 6020

International no: +61 (2) 47876020

Pay with:

Find us on