01Apr

Eicher Motors Elliott Wave Analysis Reveals Bullish Trend, Wave Count Insights, Stock Forecast, and Technical Chart Breakdown

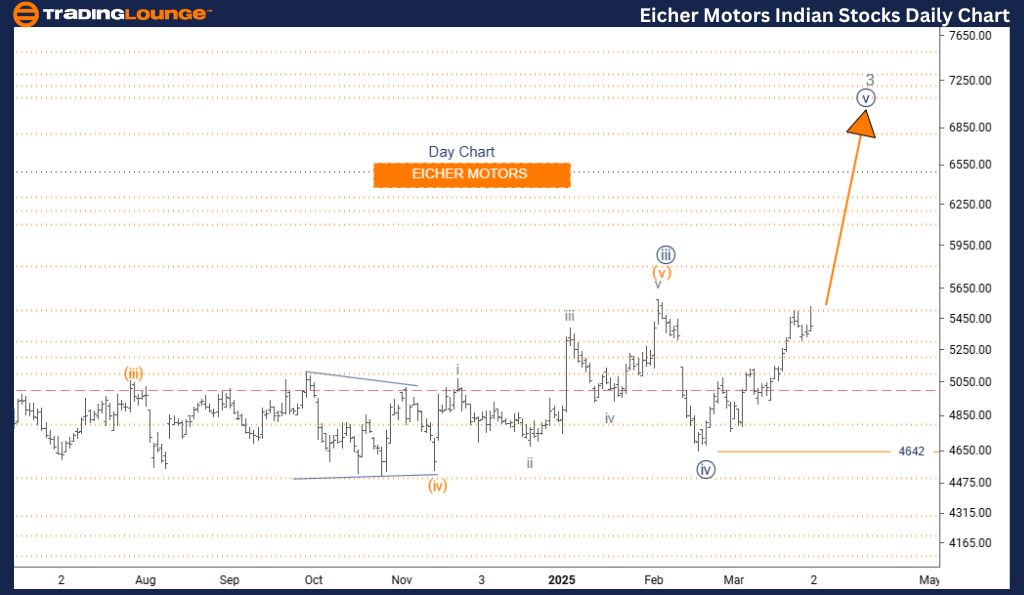
EICHER MOTORS – Elliott Wave Technical Analysis | Daily Chart

EICHERMOTO Elliott Wave Technical Analysis

Function: Bullish Trend

Mode: Impulsive

Structure: Navy Blue Wave 5

Current Position: Gray Wave 3

Next Lower Degree Direction: Gray Wave 4

Invalidation Level: 4642

Analysis Summary

The Elliott Wave daily chart for EICHER MOTORS maintains a strong bullish trend. The stock is moving in navy blue wave 5, signaling the last impulsive leg of gray wave 3.

After confirming the end of navy blue wave 4, analysts identify the market entering the final upward phase—navy blue wave 5. This move suggests the current wave cycle, which began at gray wave 1, is nearing the top of this bullish momentum.

Technical Insights

  • The invalidation level stands at 4642. Any movement below this level would question the present wave count.
  • Completion of navy blue wave 5 is expected to lead to a corrective gray wave 4, before potentially continuing in gray wave 5.
  • This wave reflects both short-term trading potential and a critical segment of the medium-term trend.

Key traits to watch during this phase:

  • Divergences in momentum indicators
  • Slowing price movement
  • Signals indicating correction or reversal

Conclusion

The bullish outlook holds, but caution is necessary as wave 5 may be nearing its end. Traders might consider adjusting risk exposure, especially if technical indicators begin to diverge. The daily setup offers valuable insights for those tracking the final leg of the upward movement in EICHER MOTORS shares.

EICHER-MOTORS-daily-...


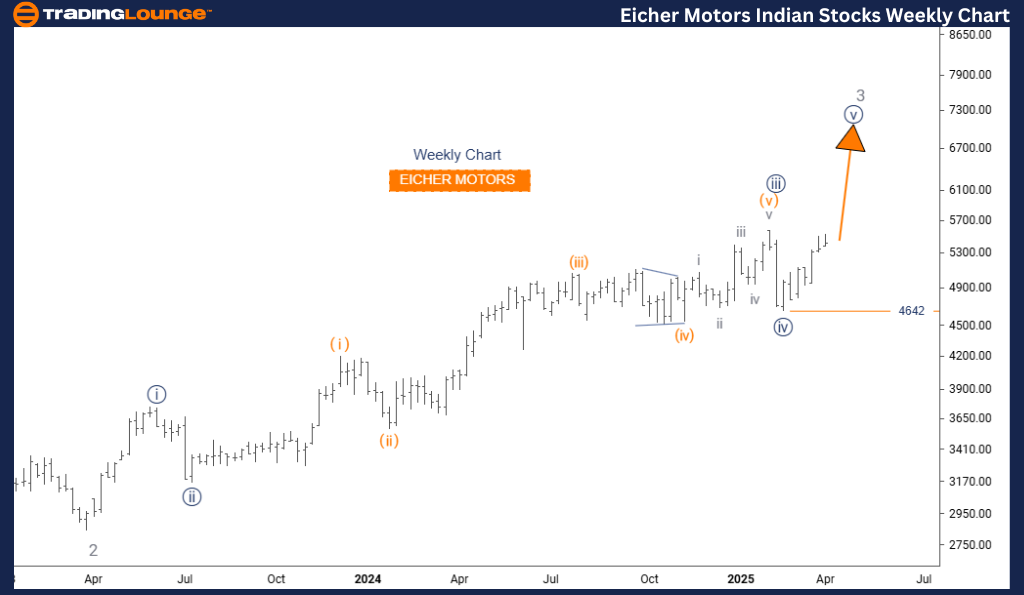
EICHER MOTORS – Elliott Wave Analysis | Weekly Chart

Function: Bullish Trend

Mode: Impulsive

Structure: Navy Blue Wave 5

Current Position: Gray Wave 3

Next Lower Degree Direction: Gray Wave 4

Invalidation Level: 4642

Analysis Summary

The weekly chart for EICHER MOTORS supports a bullish Elliott Wave pattern, currently progressing through navy blue wave 5, which concludes gray wave 3. Completion of the earlier wave 4 phase implies the market is now in the terminal part of this impulse cycle.

This indicates the stock is likely in the final phase of a major bullish sequence, initiated with gray wave 1, suggesting a possible approach toward a larger correction at the gray wave level.

Technical Insights

  • The critical invalidation point is at 4642. A decline below would invalidate the current structure.
  • The market is inside navy blue wave 5, forming part of a larger move that will eventually close gray wave 3 and begin gray wave 4.

Typical fifth wave signals include:

  • Decreasing momentum
  • Lower trading volumes
  • Divergences in trend-following indicators

These characteristics often point toward a maturing trend that could soon correct or consolidate.

Conclusion

The bullish structure stays intact, but it calls for vigilance. Investors should keep positions aligned with the trend but start to tighten risk limits as the wave structure nears completion. The weekly chart provides a broad view that helps traders stay positioned for both near-term gains and potential trend reversals.

Technical Analyst: Malik Awais

Source: visit Tradinglounge.com and learn From the Experts Join TradingLounge Here 

Previous: ASIAN PAINT Elliott Wave Technical Analysis

VALUE Offer - Buy 1 Month & Get 3 Months!Click here

Access 7 Analysts Over 200 Markets Covered. Chat Room With Support

EICHER-MOTORS-weekly...

Related

KOSPI Composite Index Elliott Wave Technical Analysis: Indicates a Strong Bullish Trend with Significant Investment Potential

KOSPI Composite Index Elliott Wave Technical Analysis: Indicates a Strong Bullish Trend with Significant Investment Potential

The latest Elliott Wave analysis on the KOSPI Composite Index indicates a strong bullish trend with ...

Read More >
Identifies the current wave structure with index market analysis: FTSE 100 (UK) Elliott Wave Technical Analysis

Identifies the current wave structure with index market analysis: FTSE 100 (UK) Elliott Wave Technical Analysis

This article provides an in-depth Elliott Wave analysis of the FTSE 100 market on both daily and wee...

Read More >
Natural Gas (NG) Trends: Navigating Elliott Wave Technical Analysis for Profitable Insights

Natural Gas (NG) Trends: Navigating Elliott Wave Technical Analysis for Profitable Insights

NG's Elliott wave analysis points to continued downside potential. Despite a recent bounce, the ...

Read More >
GBPUSD Elliott Wave Technical Analysis: Insights on Bearish Trends, Impulse Waves, Key Levels, and Effective Forex Trading Strategies

GBPUSD Elliott Wave Technical Analysis: Insights on Bearish Trends, Impulse Waves, Key Levels, and Effective Forex Trading Strategies

This article provides a detailed GBPUSD Elliott Wave analysis focusing on bearish trends and impulsi...

Read More >
NextEra Energy Inc. (NEE) Stocks Elliott Wave Technical Analysis: Focusing on the Current Market Trends and Price Predictions

NextEra Energy Inc. (NEE) Stocks Elliott Wave Technical Analysis: Focusing on the Current Market Trends and Price Predictions

This article provides an in-depth Elliott Wave analysis of NextEra Energy Inc. (NEE), focusing on th...

Read More >
Understand how Elliott Wave Theory Applies to DIS Stock's Future Trajectory: The Walt Disney Co. Technical Analysis

Understand how Elliott Wave Theory Applies to DIS Stock's Future Trajectory: The Walt Disney Co. Technical Analysis

Explore an in-depth Elliott Wave analysis of The Walt Disney Co. (DIS), highlighting current price m...

Read More >

Buy 1 Month

Get 3 Months!

Special Offer:

Trade Recommendations

Unleash the power of deversified trading with our comprehensive portfolio, covering:

  • Stock Trades
  • Crypto Trades
  • Forex Trades
  • Commodity Trades
Elliott Wave Analysis

Gain a competive edge with expert insights in to:

  • Global Indices
  • US Stocks & ASX Stocks
  • Forex & Crypto
  • Commodities
Top-Notch Trading Tools

Equip yourself with the tools of success:

  • Social Chat
  • Elliott Wave Algorithm
  • Screener
  • TradingLevels
  • Trading Game
7 Elliott Wave Analysts

Stay ahead of the market with daily charts and insightful videos
-Your secret to strategic trading!

JOIN HERE


Welcome to TradingLounge (ASIC A.R.No. 321187), specialists in trades, trading education and technical analysis, covering stocks, indices, commodities, forex and cryptocurrencies.

When you join TradingLounge you have access to everything we offer, including trade tools, educational content and a social platform to chat with like-minded investors.

Read more

@Copyright 2024 by tradinglounge.com

Contact Us

Australian no: 02 4787 6020

International no: +61 (2) 47876020

Pay with:

Find us on