Mahindra & Mahindra – M_M Elliott Wave Technical Analysis (1D Chart)

M_M Elliott Wave Technical Analysis

Function: Larger Degree Trend Higher (Intermediate Degree, Wave (5) Orange)

Mode: Motive

Structure: Impulse

Position: Minute Wave ((v)) Navy

Details: Minute Wave ((v)) Navy is moving upward within Minor Wave 3 Grey of Intermediate Wave (5) Orange, with a critical risk level tightened at 2640.

Invalidation Point: 2640

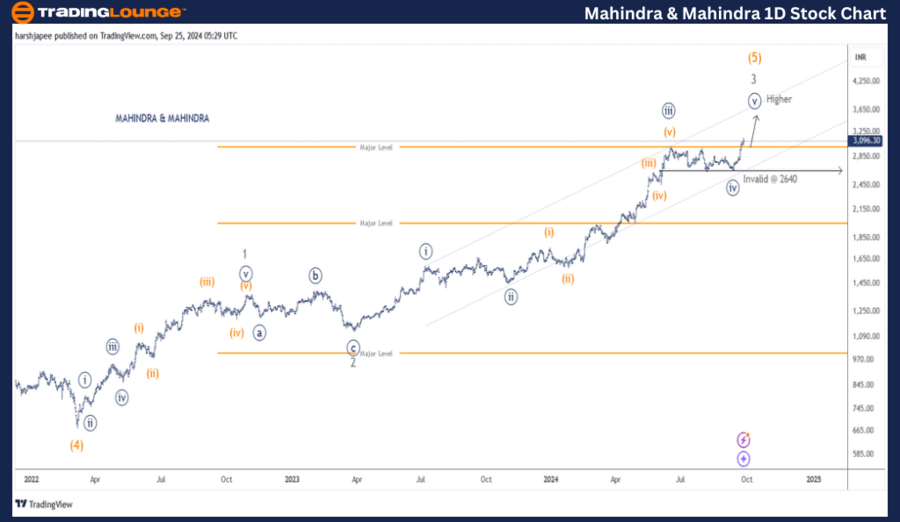
MAHINDRA & MAHINDRA Daily Chart Technical Analysis and Potential Elliott Wave Counts

The daily chart for Mahindra & Mahindra indicates a continued uptrend targeting the 3300-3400 range in the short term. Minute Wave ((v)) is advancing within Minor Wave 3 Grey of Intermediate Wave (5) Orange. The immediate support level and risk management point is set at 2640.

The stock has been in an upward movement since the March 2022 lows of around 670-75, marking the end of Intermediate Wave (4) Orange. Minor Wave 1 Grey completed near 1370, followed by Minor Wave 2 Grey, an expanded flat, near the 1120 level.

Currently, Minor Wave 3 Grey is extended and within its final upward push. Minute Wave ((v)) is expected to reach at least 3200-3300. The risk level is now tightened at 2640, as a break below this level would suggest the end of Wave 3.

Mahindra-&-Mahindra-...


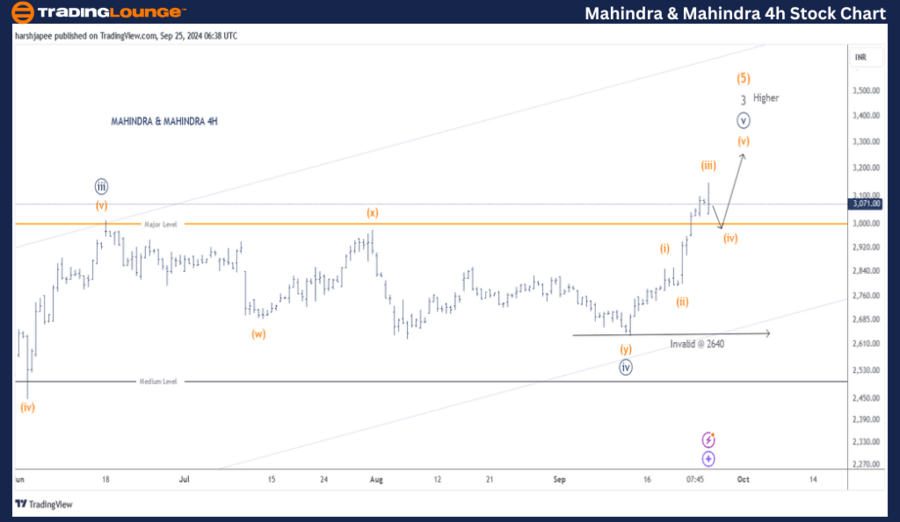
MAHINDRA & MAHINDRA – M_M Elliott Wave / Technical Analysis (4H Chart)

Function: Larger Degree Trend Higher (Intermediate Degree, Wave (5) Orange)

Mode: Motive

Structure: Impulse

Position: Minute Wave ((v)) Navy

Details: Minute Wave ((v)) Navy is progressing higher within Minor Wave 3 Grey of Intermediate Wave (5) Orange, with critical support at 2640. It’s possible that Minuette Wave (iii) Orange completed around the 3150 mark, and if accurate, Minuette Wave (iv) may pull back slightly before the upward trend continues.

Invalidation Point: 2640

MAHINDRA & MAHINDRA 4H Chart Technical Analysis and Potential Elliott Wave Counts

The 4-hour chart of Mahindra & Mahindra shows the sub-waves after Minute Wave ((iii)) topped near the 3000 mark. Wave ((iv)) unfolded as a combination before concluding near 2640. From that point, Minute Wave ((v)) is potentially advancing towards the 3300 level.

Technical Analyst: Harsh Japee

Source: visit Tradinglounge.com and learn From the Experts Join TradingLounge Here 

Previous: COAL INDIA LTD Elliott Wave Technical Analysis

VALUE Offer - Buy 1 Month & Get 3 Months!Click here

Access 7 Analysts Over 200 Markets Covered. Chat Room With Support

Mahindra-&-Mahindra-...


Conclusion:

Mahindra & Mahindra is expected to continue rising towards the 3200-3300 range as Minute Wave ((v)) progresses within Minor Wave 3 Grey of Intermediate Wave (5) Orange.


Related

NASDAQ Elliott Wave Analysis: SPX, JPM, AAPL, AMZN, NVDA, TSLA, GOOGL, META, NFLX, MSFT 2024 Forecast

NASDAQ Elliott Wave Analysis: SPX, JPM, AAPL, AMZN, NVDA, TSLA, GOOGL, META, NFLX, MSFT 2024 Forecast

This article offers a detailed Elliott Wave analysis of the NASDAQ stock market, focusing on key tec...

Read More >
McDonald’s Corp.(MCD) MCD Elliott Wave Technical Analysis 29 January 24

McDonald’s Corp.(MCD) MCD Elliott Wave Technical Analysis 29 January 24

McDonald’s Corp.(MCD) MCD Elliott Wave Technical Analysis dated 29 January 24, MCD Elliott Wave Ana...

Read More >
Dow Jones (DJI) Elliott Wave Technical Analysis: Key Insights on Market Trends and Forecast

Dow Jones (DJI) Elliott Wave Technical Analysis: Key Insights on Market Trends and Forecast

This comprehensive Dow Jones Elliott Wave analysis examines both daily and weekly chart movements, f...

Read More >
Visa Inc. (V) Elliott Wave Technical Analysis 1 February 24: Navigating Trends and Corrections for Informed Trading

Visa Inc. (V) Elliott Wave Technical Analysis 1 February 24: Navigating Trends and Corrections for Informed Trading

Discover the latest insights on Visa Inc. (V) through our Elliott Wave Analysis Trading Lounge. Delv...

Read More >
Euro Stoxx 50 Index Elliott Wave Technical Analysis Exhibits a Strong Bullish Trend on the Daily and Weekly Chart

Euro Stoxx 50 Index Elliott Wave Technical Analysis Exhibits a Strong Bullish Trend on the Daily and Weekly Chart

The Euro Stoxx 50 index exhibits a strong bullish trend on the weekly chart, with an impulsive Orang...

Read More >
JNJ Elliott Wave Technical Analysis: An In-depth Look at Johnson & Johnson's Market Movements

JNJ Elliott Wave Technical Analysis: An In-depth Look at Johnson & Johnson's Market Movements

This article provides an in-depth analysis of Johnson & Johnson (JNJ) stock, covering everything fro...

Read More >

Buy 1 Month

Get 3 Months!

Special Offer:

Trade Recommendations

Unleash the power of deversified trading with our comprehensive portfolio, covering:

  • Stock Trades
  • Crypto Trades
  • Forex Trades
  • Commodity Trades
Elliott Wave Analysis

Gain a competive edge with expert insights in to:

  • Global Indices
  • US Stocks & ASX Stocks
  • Forex & Crypto
  • Commodities
Top-Notch Trading Tools

Equip yourself with the tools of success:

  • Social Chat
  • Elliott Wave Algorithm
  • Screener
  • TradingLevels
  • Trading Game
7 Elliott Wave Analysts

Stay ahead of the market with daily charts and insightful videos
-Your secret to strategic trading!

JOIN HERE


Welcome to TradingLounge (ASIC A.R.No. 321187), specialists in trades, trading education and technical analysis, covering stocks, indices, commodities, forex and cryptocurrencies.

When you join TradingLounge you have access to everything we offer, including trade tools, educational content and a social platform to chat with like-minded investors.

Read more

@Copyright 2024 by tradinglounge.com

Contact Us

Australian no: 02 4787 6020

International no: +61 (2) 47876020

Pay with:

Find us on