21Jun

New Zealand Dollar/ U.S. Dollar (NZDUSD) Elliott Wave Forecast Shows Bullish Wave 3 Trend with Technical Analysis for Forex Traders

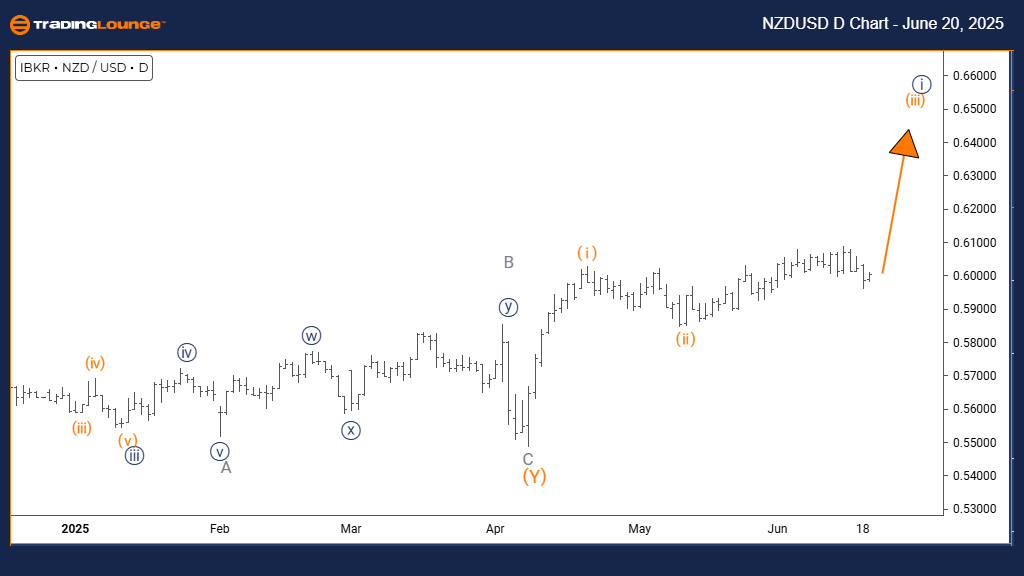
New Zealand Dollar/ U.S. Dollar (NZDUSD) Elliott Wave Analysis | Trading Lounge Day Chart

NZDUSD Elliott Wave Technical Analysis

FUNCTION: Bullish Trend

MODE: Impulsive

STRUCTURE: Orange wave 3

POSITION: Navy blue wave 3

DIRECTION NEXT HIGHER DEGREES: Orange wave 3 (initiated)

DETAILS: Orange wave 2 seems finalized; orange wave 3 currently unfolding.

The NZDUSD daily chart Elliott Wave analysis outlines a strong bullish trend. The market is progressing in impulsive mode, indicating sustained upside momentum. Price activity highlights orange wave 3, which is nested within a broader navy blue wave 3, signaling that the currency pair is in a powerful phase of its Elliott wave cycle—where third waves typically show increased strength.

This analysis confirms the completion of orange wave 2, with orange wave 3 now underway. This phase is often characterized by aggressive price moves, aligning with Elliott Wave principles. Traders should observe how this third wave develops within the navy blue wave 3 cycle, as it could offer valuable entry points.

Current chart signals align with a continued bullish scenario. With orange wave 3 now active, this configuration suggests strong upside potential and sustained buying interest in the near term.

NZDUSD-d-forex-chart...


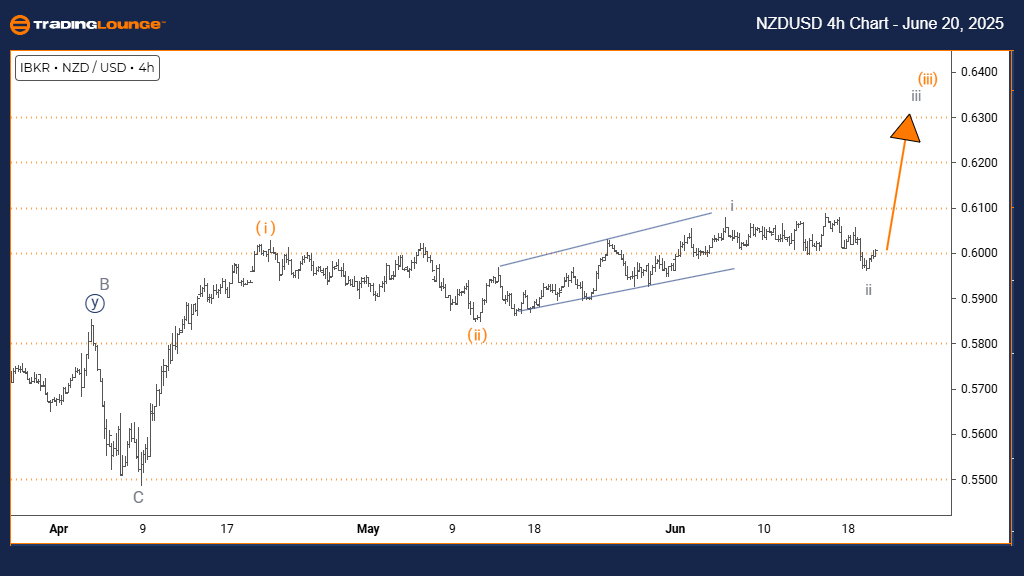
New Zealand Dollar/ U.S. Dollar (NZDUSD) Elliott Wave Analysis | Trading Lounge 4-Hour Chart

NZDUSD Elliott Wave Technical Analysis

FUNCTION: Bullish Trend

MODE: Impulsive

STRUCTURE: Gray wave 3

POSITION: Orange wave 3

DIRECTION NEXT HIGHER DEGREES: Gray wave 3 (underway)

DETAILS: Gray wave 2 appears complete; gray wave 3 unfolding.

On the NZDUSD 4-hour chart, the Elliott Wave outlook confirms a bullish structure. The pair is in impulsive mode, demonstrating clear upward momentum. Gray wave 3 has emerged within the broader orange wave 3 framework, reinforcing a sustained uptrend in the short-term timeframe.

The transition from gray wave 2 to gray wave 3 suggests renewed bullish energy. Historically, third waves are known for their decisive movements, and this setup aligns with that expectation. Traders may find actionable opportunities as the gray wave 3 gains traction within the orange wave 3's upward momentum.

Technical conditions remain favorable for further gains. With gray wave 3 progressing, bullish momentum remains intact, supporting the prospect of continued appreciation for the NZDUSD in upcoming sessions.

Technical Analyst: Malik Awais

Source: Visit Tradinglounge.com and learn from the Experts. Join TradingLounge Here

Previous: EURUSD Elliott Wave Technical Analysis

VALUE Offer - $1 for 2 Weeks then $29 a month!Click here

Access 7 Analysts Over 200 Markets Covered. Chat Room With Support

NZDUSD-4h-forex-char...

Related

Fortinet Inc. (FTNT) Stocks Elliott Wave Technical Analysis: Covering Daily Chart and 1-hour Chart, Indicating a Bullish Trend

Fortinet Inc. (FTNT) Stocks Elliott Wave Technical Analysis: Covering Daily Chart and 1-hour Chart, Indicating a Bullish Trend

This article provides a detailed Elliott Wave analysis of Fortinet Inc. (FTNT), covering daily and 1...

Read More >
COAL INDIA Elliott Wave Chart Analysis Highlights Corrective Wave B and Bearish Continuation into Wave C with Key Invalidation Level

COAL INDIA Elliott Wave Chart Analysis Highlights Corrective Wave B and Bearish Continuation into Wave C with Key Invalidation Level

Detailed COAL INDIA Elliott Wave analysis reveals a corrective phase in Wave B. Learn forecast, trad...

Read More >
U.S.Dollar/Swiss Franc(USDCHF) Elliott Wave Analysis: Daily Chart Review - February 2, 2024

U.S.Dollar/Swiss Franc(USDCHF) Elliott Wave Analysis: Daily Chart Review - February 2, 2024

Unlock profitable trading opportunities with expert insights from the latest USDCHF Elliott Wave Ana...

Read More >
Elliott Wave Trading Strategies: SP500, NASDAQ 100, and Top Tech Stocks Analysis

Elliott Wave Trading Strategies: SP500, NASDAQ 100, and Top Tech Stocks Analysis

This analysis explores Elliott Wave technical insights for major indices and leading tech stocks. Th...

Read More >
Polkadot/U.S. dollar(DOTUSD) Elliott Wave Technical Analysis 19 January 24

Polkadot/U.S. dollar(DOTUSD) Elliott Wave Technical Analysis 19 January 24

Polkadot and U.S. dollar(DOTUSD) Elliott Wave Technical Analysis dated 19 January 24, Polkadot/U.S. ...

Read More >
 Bitcoin Elliott Wave Analysis: BTCUSD Chart Breakdown for Optimized Trading Strategies and Accurate Price Predictions

Bitcoin Elliott Wave Analysis: BTCUSD Chart Breakdown for Optimized Trading Strategies and Accurate Price Predictions

This analysis provides an in-depth look at Bitcoin's Elliott Wave patterns, focusing on BTCUSD&#...

Read More >

$1 for 2 Weeks

then $29 a month!

What a Special Offer!

Trade Recommendations

Unleash the power of deversified trading with our comprehensive portfolio, covering 250+ markets:

  • Stock Trades
  • Crypto Trades
  • Forex Trades
  • Commodity Trades
Elliott Wave Analysis

Gain a competitive edge with expert insights and AI-powered Elliott Wave charting into:

  • Global Indices
  • US Stocks & ASX Stocks
  • Forex & Crypto
  • Commodities
Top-Notch Trading Tools

Equip yourself with the tools of success:

  • Real-time Chat rooms
  • Elliott Wave Algorithm
  • Portfolio tools
  • TradingLevels
  • Screener
  • Trading Game
7 Elliott Wave Analysts

Stay ahead of the market with daily charts and insightful videos
Your secret to strategic trading!

JOIN HERE


Welcome to TradingLounge (ASIC A.R.No. 321187), specialists in trades, trading education and technical analysis, covering stocks, indices, commodities, forex and cryptocurrencies.

When you join TradingLounge you have access to everything we offer, including trade tools, educational content and a social platform to chat with like-minded investors.

Read more

@Copyright 2024 by tradinglounge.com

Contact Us

Australian no: 02 4787 6020

International no: +61 (2) 47876020

Pay with:

Find us on