Welcome to our latest Elliott Wave analysis for Salesforce Inc. (CRM). This analysis offers insights into CRM's price movements using Elliott Wave Theory, helping traders identify potential opportunities based on the current trend. We will explore both the daily and 1-hour charts for a thorough understanding of CRM's market behavior.

CRM Elliott Wave Analysis – Trading Lounge Daily Chart

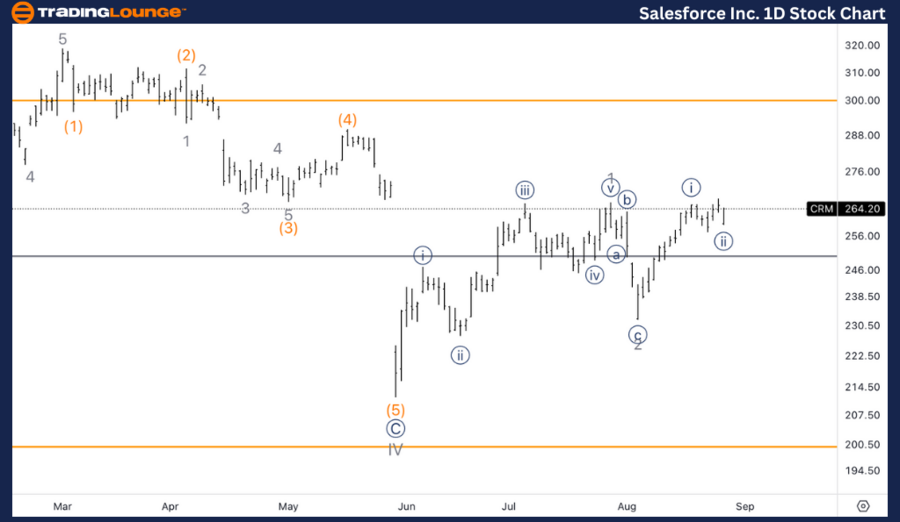
Salesforce Inc. (CRM) Daily Chart Analysis

CRM Elliott Wave Technical Analysis

Function: Trend

Mode: Impulsive

Structure: Motive

Position: Minor wave 3

Direction: Upside into wave 3

Details: We are observing the possibility that a multi-year correction has concluded, and CRM is now resuming its upward movement. As CRM approaches the $265 level, it is crucial to find support here to sustain the upward trend.

CRM Elliott Wave Technical Analysis – Daily Chart

CRM appears to be resuming its uptrend after what seems to be the completion of a multi-year correction. As CRM advances within Minor wave 3, the price must find support near the $265 mark to maintain this upward momentum. Successfully establishing support at this level would confirm the bullish outlook, indicating that the uptrend remains intact and CRM could continue to rise.

Salesforce-Inc-1D-St...


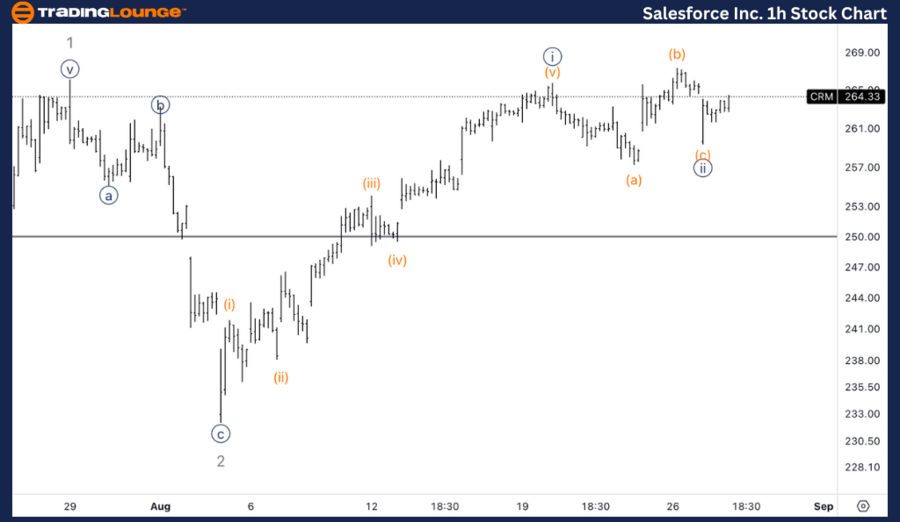
CRM Elliott Wave Analysis – Trading Lounge 1H Chart

Salesforce Inc. (CRM) 1H Chart Analysis

CRM Elliott Wave Technical Analysis

Function: Trend

Mode: Impulsive

Structure: Motive

Position: Wave {ii} of 3

Direction: Bottom in wave {ii}

Details: We are looking for a bottom in wave {ii} following a three-wave corrective move after breaking the previous high, which marked the top of wave {i}.

CRM Stock Technical Analysis – 1H Chart

The 1-hour chart suggests that CRM may have completed a corrective wave {ii} within Minor wave 3. This correction appears to have taken the form of a three-wave pattern, typical of corrective phases. After breaking the previous high, which marked the top of wave {i}, CRM now seems ready to resume its upward movement. A confirmed bottom in wave {ii} would indicate that the next phase higher in wave {iii} is likely to begin.

Technical Analyst: Alessio Barretta

Source: visit Tradinglounge.com and learn From the Experts Join TradingLounge Here 

See Previous: Apple inc. Elliott Wave Technical Analysis 

Special Trial Offer - 0.76 Cents a Day for 3 Months! Click here

Access 7 Analysts Over 200 Markets Covered. Chat Room With Support

Salesforce-Inc-1h-St...

Related

NVDA's Future: NVIDIA Corp. (NVDA) Elliott Wave Technical Analysis Reveals Insights

NVDA's Future: NVIDIA Corp. (NVDA) Elliott Wave Technical Analysis Reveals Insights

Elliott Wave analysis of NVIDIA Corp. (NVDA) as of February 21, 24, unveils a tale of intricate wave...

Read More >
NextEra Energy (NEE) Approaches Bullish Reversal: Elliott Wave Analysis Highlights Key Technical Levels and Wave Forecast Targets

NextEra Energy (NEE) Approaches Bullish Reversal: Elliott Wave Analysis Highlights Key Technical Levels and Wave Forecast Targets

NextEra Energy (NEE) is nearing the end of a corrective wave, setting up for a potential bullish rev...

Read More >
McDonald's Corporation (MCD) Elliott Wave Analysis: A Comprehensive Daily and 4-Hour Chart Review

McDonald's Corporation (MCD) Elliott Wave Analysis: A Comprehensive Daily and 4-Hour Chart Review

This comprehensive guide dives into the intricacies of McDonald's (MCD) stock through detailed E...

Read More >
New Zealand Dollar/U.S. Dollar (NZDUSD) Elliott Wave Technical Analysis: 4-Hour & Daily Chart Overview, February 13, 2024

New Zealand Dollar/U.S. Dollar (NZDUSD) Elliott Wave Technical Analysis: 4-Hour & Daily Chart Overview, February 13, 2024

Expert insights into NZDUSD analysis and forecasts, covering the New Zealand Dollar/U.S. Dollar curr...

Read More >
Unlocking ASX Trading Success: SUNCORP GROUP LIMITED – SUN Stock Analysis & Elliott Wave Technical Forecast

Unlocking ASX Trading Success: SUNCORP GROUP LIMITED – SUN Stock Analysis & Elliott Wave Technical Forecast

(Suncorp Group Limited) provides a detailed Elliott Wave breakdown, including price targets, wave st...

Read More >
Binance/ U.S. dollar(BNBUSD) Elliott Wave Technical Analysis 7 December 23

Binance/ U.S. dollar(BNBUSD) Elliott Wave Technical Analysis 7 December 23

Binance/ U.S. dollar(BNBUSD) Elliott Wave Technical Analysis dated 7 December 23 Binance and US doll...

Read More >

Buy 1 Month

Get 3 Months!

Special Offer:

Trade Recommendations

Unleash the power of deversified trading with our comprehensive portfolio, covering:

  • Stock Trades
  • Crypto Trades
  • Forex Trades
  • Commodity Trades
Elliott Wave Analysis

Gain a competive edge with expert insights in to:

  • Global Indices
  • US Stocks & ASX Stocks
  • Forex & Crypto
  • Commodities
Top-Notch Trading Tools

Equip yourself with the tools of success:

  • Social Chat
  • Elliott Wave Algorithm
  • Screener
  • TradingLevels
  • Trading Game
7 Elliott Wave Analysts

Stay ahead of the market with daily charts and insightful videos
-Your secret to strategic trading!

JOIN HERE


Welcome to TradingLounge (ASIC A.R.No. 321187), specialists in trades, trading education and technical analysis, covering stocks, indices, commodities, forex and cryptocurrencies.

When you join TradingLounge you have access to everything we offer, including trade tools, educational content and a social platform to chat with like-minded investors.

Read more

@Copyright 2024 by tradinglounge.com

Contact Us

Australian no: 02 4787 6020

International no: +61 (2) 47876020

Pay with:

Find us on