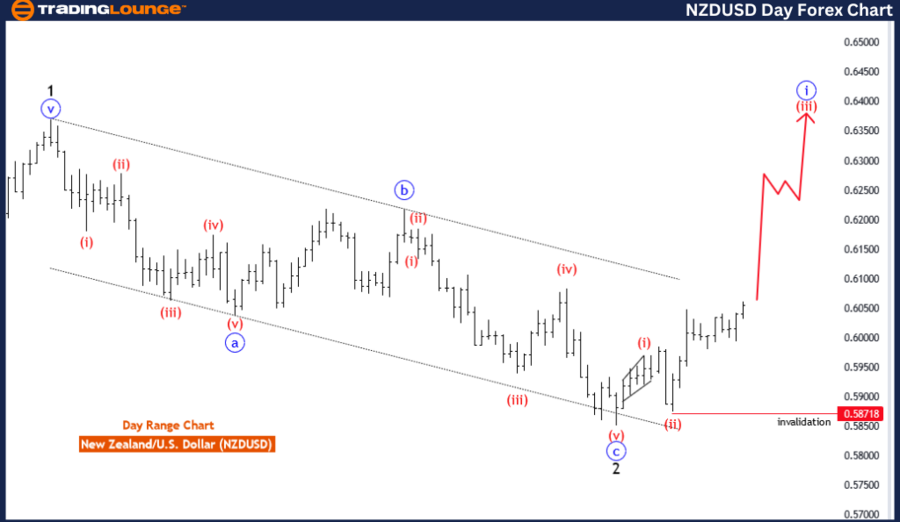
NZDUSD Elliott Wave Analysis Trading Lounge Day Chart,
New Zealand Dollar/U.S.Dollar(NZDUSD) Day Chart
NZDUSD Elliott Wave Technical Analysis
FUNCTION: Trend
MODE: impulsive
STRUCTURE: red wave 3
POSITION: Blue Wave 1
DIRECTION NEXT LOWER DEGREES: red wave 4
DETAILS: red wave 2, now red wave 3 of 1 is in play.
Wave Cancel invalid level: 0.58718
The daily chart analysis of the NZD/USD (New Zealand Dollar/U.S. Dollar) pair, based on Elliott Wave theory, offers a detailed examination of the ongoing price movements and future trends.
Function:
The analysis identifies the function as "Trend," indicating that the current market movement is aligned with a broader trend direction, suggesting a sustained and potentially significant directional movement in the market.
Mode:
The mode is described as "impulsive," signifying that the market is currently in an impulsive phase. Impulsive waves in Elliott Wave theory are characterized by strong, directional price movements, typically structured in five sub-waves, and indicate a robust trend continuation.
Structure:
The structure in focus is "red wave 3," which is part of the broader impulsive wave sequence. This suggests that the NZD/USD is currently progressing through the third wave of this impulsive sequence, often the most powerful and extended wave, reflecting strong market momentum.
Position:
The position is identified as "blue wave 1," indicating that within the larger impulsive wave, the market is in the initial wave of a new sequence. This highlights that the market is in the early stages of an upward impulsive phase.
Direction for Next Lower Degrees:
The direction for the next lower degrees is indicated as "red wave 4," implying that after the completion of the current impulsive wave (red wave 3), a corrective wave (red wave 4) is expected to follow. This corrective wave would typically retrace some of the gains made during the impulsive phase, providing a potential buying opportunity in the context of the larger trend.
Details:
The analysis provides specific details, noting that "red wave 2" has been completed. Now, "red wave 3 of 1" is in play, indicating that the market is experiencing a strong impulsive wave. The wave cancellation or invalidation level is set at 0.58718. If the price falls below this level, the current wave count would be invalidated, indicating a potential shift in market dynamics.
In summary, the daily Elliott Wave analysis of the NZD/USD pair suggests that the market is currently experiencing a strong impulsive wave within a broader upward trend. The completion of "red wave 2" sets the stage for a significant upward movement in "red wave 3 of 1," with close monitoring required around the invalidation level of 0.58718. This analysis provides valuable insights for traders and analysts tracking the NZD/USD pair's price movements.
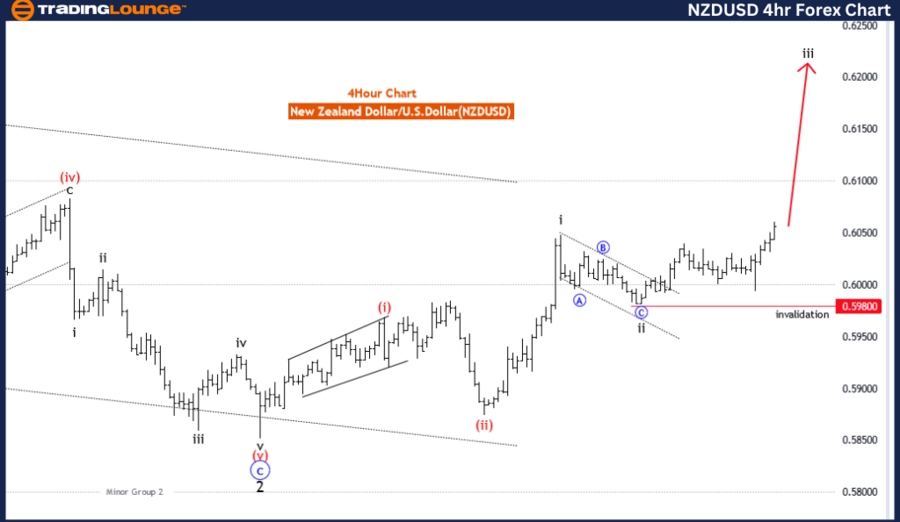
NZDUSD Elliott Wave Analysis Trading Lounge 4-Hour Chart,
New Zealand Dollar/U.S.Dollar(NZDUSD) 4 Hour Chart
NZDUSD Elliott Wave Technical Analysis
FUNCTION: Trend
MODE: impulsive
STRUCTURE: black wave 3
POSITION: Red Wave 3
DIRECTION NEXT LOWER DEGREES: black wave 4
DETAILS: black wave 2 of 3 looking completed at 0.59800, now black wave 3 of 3 is in play.
Wave Cancel invalid level: 0.59800
The 4-hour chart analysis of the NZD/USD (New Zealand Dollar/U.S. Dollar) pair, based on Elliott Wave theory, provides detailed insights into the ongoing price movements and potential future trends.
Function:
The analysis identifies the function as "Trend," indicating that the current market movement is aligned with a broader trend direction. This implies a sustained and potentially significant movement in a particular direction, in this case, an upward trend.
Mode:
The mode is described as "impulsive," suggesting that the current wave is part of an impulsive phase. Impulsive waves are characterized by strong, directional movements that follow the trend, typically comprising five sub-waves.
Structure:
The structure in focus is "black wave 3," which is a critical part of the impulsive wave sequence. This suggests that the NZD/USD is currently progressing through the third wave of an impulsive pattern, often the strongest and most extended wave in an Elliott Wave sequence.
Position:
The position is identified as "red wave 3," indicating the current sub-wave within the broader "black wave 3." This highlights that the market is in the midst of the third wave of the impulsive sequence, which often exhibits strong price movements.
Direction for Next Lower Degrees:
The direction for the next lower degrees is marked as "black wave 4," implying that after the completion of the current impulsive wave (black wave 3), a corrective wave (black wave 4) is expected to follow. This corrective wave would typically retrace some of the gains made during the impulsive phase.
Details:
The analysis provides specific details, noting that "black wave 2 of 3" appears to have completed at the level of 0.59800. Now, "black wave 3 of 3" is in play, suggesting that the market is in the midst of a strong impulsive wave. The wave cancellation or invalidation level is set at 0.59800. If the price falls below this level, the current wave count would be invalidated, indicating a potential shift in market dynamics.
In summary, the 4-hour Elliott Wave analysis of the NZD/USD pair suggests that the market is currently experiencing a strong impulsive wave within a broader upward trend. The completion of "black wave 2 of 3" at 0.59800 sets the stage for a significant upward movement in "black wave 3 of 3," with close monitoring required around the invalidation level of 0.59800. This analysis provides valuable guidance for traders and analysts tracking the NZD/USD pair's price movements.
Technical Analyst: Malik Awais
Source: visit Tradinglounge.com and learn From the Experts Join TradingLounge Here
See Previous: Euro/British Pound(EURGBP) Forex Elliott Wave Technical Analysis
Special Trial Offer - 0.76 Cents a Day for 3 Months! Click here
Access 7 Analysts Over 170 Markets Covered. Chat Room With Support