08Mar

Wheat Elliott Wave Technical Analysis: Latest Price Forecast, Market Trends, and Trading Strategy for 2025 Commodity Futures

Wheat Elliott Wave Analysis 

Wheat is approaching the completion of a long-term bearish impulse wave that started in March 2022. A potential multi-week or multi-month corrective bounce may follow soon. In the short term, the bearish trend resumed from the February 2025 high after a seven-week rebound that began in late July 2024.


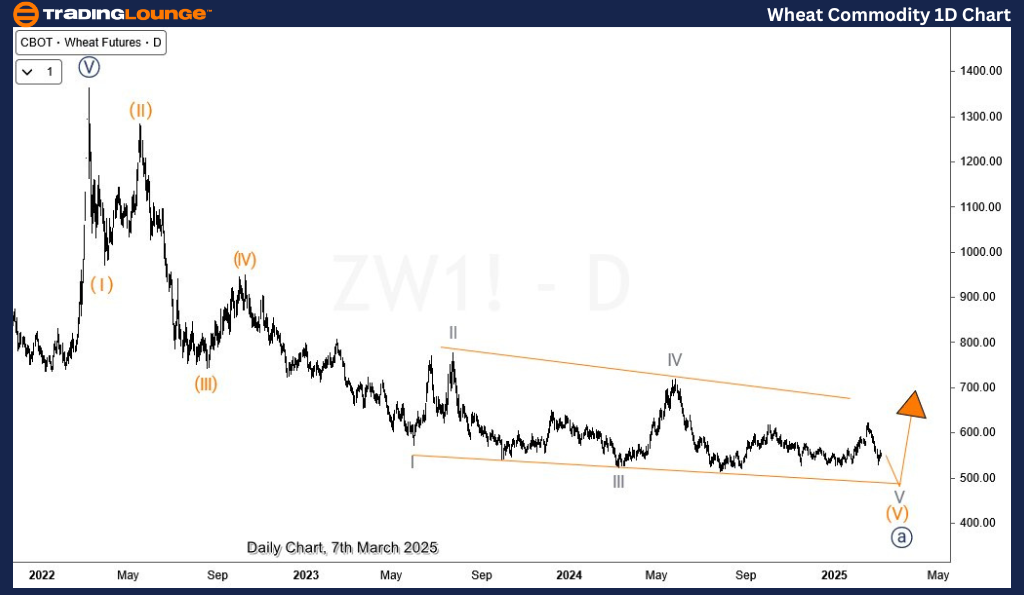
Wheat Daily Chart Analysis

On the daily chart, wheat is finalizing a bearish impulse wave that originated in March 2022. The 5th wave (wave V) has developed as an ending diagonal structure since October 2022. This structure is now approaching completion, with wave V of (V) likely extending toward $500 or below.

Wheat-1d-commodity-c...


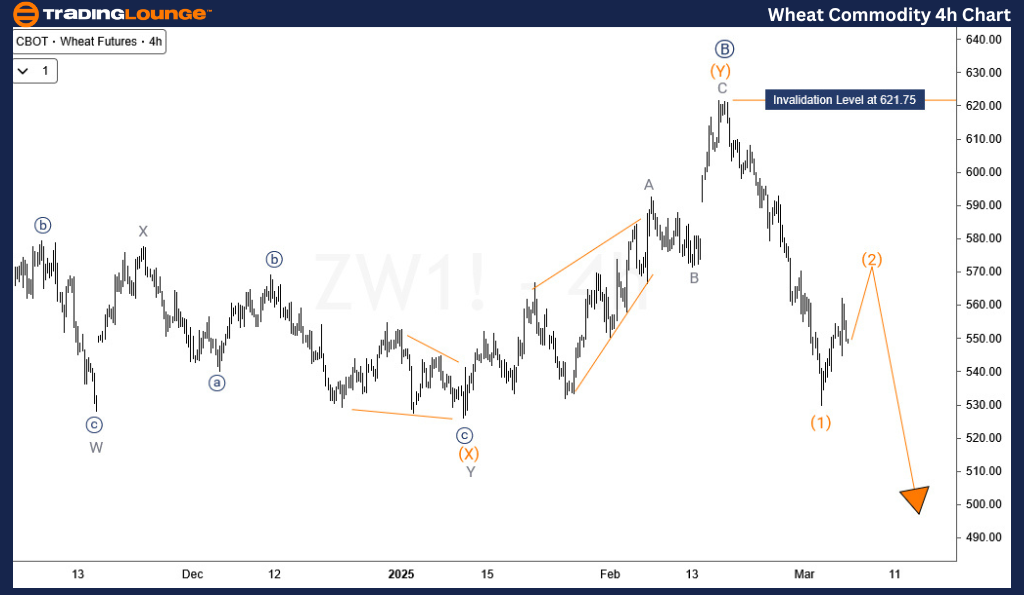
Wheat H4 Chart Analysis

On the H4 chart, wheat completed waves ((A)) and ((B)) of V in July 2024 and February 2025, respectively. Since February 2025, wave ((C)) of V has resumed its downward move. Following a 5-wave decline in wave (1), the price is currently experiencing a corrective rebound in wave (2) of ((C)).

  • As long as the 621.75 resistance level holds, the short-term outlook remains bearish, targeting $500 or below.
  • However, traders should closely monitor price action near $500, as a strong bullish corrective phase may emerge around this level.

Technical Analyst: Sanmi Adeagbo

Source: visit Tradinglounge.com and learn From the Experts Join TradingLounge Here 

See Previous: WTI Crudeoil Elliott Wave Technical Analysis

VALUE Offer - Buy 1 Month & Get 3 Months!Click here

Access 7 Analysts Over 200 Markets Covered. Chat Room With Support

Wheat-4h-commodity-c...

Related

GBPAUD Elliott Wave Analysis: Daily Wave 2 Correction & 4‑Hour Wave B Retracement Ahead of Potential Forecasted Breakouts

GBPAUD Elliott Wave Analysis: Daily Wave 2 Correction & 4‑Hour Wave B Retracement Ahead of Potential Forecasted Breakouts

GBPAUD Elliott Wave analysis reveals ongoing corrective waves on both daily (navy blue wave 2 withi...

Read More >
Fortinet Inc. (FTNT) Stocks Elliott Wave Technical Analysis: Covering Daily Chart and 1-hour Chart, Indicating a Bullish Trend

Fortinet Inc. (FTNT) Stocks Elliott Wave Technical Analysis: Covering Daily Chart and 1-hour Chart, Indicating a Bullish Trend

This article provides a detailed Elliott Wave analysis of Fortinet Inc. (FTNT), covering daily and 1...

Read More >
Gain Insights into Stock Market Trends and Analysis: RUSSELL 2000 Indices Elliott Wave Technical Analysis

Gain Insights into Stock Market Trends and Analysis: RUSSELL 2000 Indices Elliott Wave Technical Analysis

Dive into our comprehensive guide on Elliott Wave Analysis and the Russell 2000 Index. Understand th...

Read More >
Corn Commodity Elliott Wave Technical Analysis: Market Outlook for Precise Trading Decisions

Corn Commodity Elliott Wave Technical Analysis: Market Outlook for Precise Trading Decisions

Corn futures continue to follow a bearish Elliott Wave pattern, with key resistance at 504.5 and pot...

Read More >
Examining CRM's price movements using daily and 4-hour charts: Salesforce Inc. (CRM) Stocks Elliott Wave Technical Analysis

Examining CRM's price movements using daily and 4-hour charts: Salesforce Inc. (CRM) Stocks Elliott Wave Technical Analysis

Discover our latest Elliott Wave analysis for Salesforce Inc. (CRM), thoroughly examining CRM's ...

Read More >

$1 for 2 Weeks

then $29 a month!

What a Special Offer!

Trade Recommendations

Unleash the power of deversified trading with our comprehensive portfolio, covering 250+ markets:

  • Stock Trades
  • Crypto Trades
  • Forex Trades
  • Commodity Trades
Elliott Wave Analysis

Gain a competitive edge with expert insights and AI-powered Elliott Wave charting into:

  • Global Indices
  • US Stocks & ASX Stocks
  • Forex & Crypto
  • Commodities
Top-Notch Trading Tools

Equip yourself with the tools of success:

  • Real-time Chat rooms
  • Elliott Wave Algorithm
  • Portfolio tools
  • TradingLevels
  • Screener
  • Trading Game
7 Elliott Wave Analysts

Stay ahead of the market with daily charts and insightful videos
Your secret to strategic trading!

JOIN HERE


Welcome to TradingLounge (ASIC A.R.No. 321187), specialists in trades, trading education and technical analysis, covering stocks, indices, commodities, forex and cryptocurrencies.

When you join TradingLounge you have access to everything we offer, including trade tools, educational content and a social platform to chat with like-minded investors.

Read more

@Copyright 2024 by tradinglounge.com

Contact Us

Australian no: 02 4787 6020

International no: +61 (2) 47876020

Pay with:

Find us on