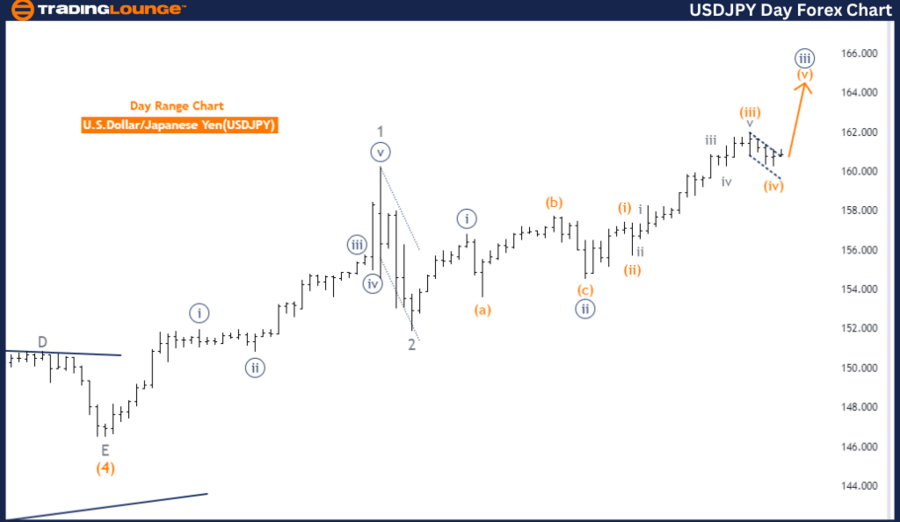
USD/JPY Elliott Wave Analysis - Day Chart
USD/JPY Daily Chart Analysis
Function: Trend
Mode: Impulsive
Structure: Orange Wave 5
Position: Navy Blue Wave 3
Direction Next Lower Degrees: Navy Blue Wave 4
Details: Orange wave 4 completed at 155.721, now orange wave 5 is in play.
USD/JPY Elliott Wave Technical Analysis
The USD/JPY Elliott Wave analysis on the day chart identifies the current trend and wave structure of the currency pair. This analysis indicates a trend function, meaning the market is moving in a specific direction with clear momentum. The mode is impulsive, highlighting strong and definite movement in the market.
The wave structure under examination is orange wave 5, part of a larger wave pattern. The current position within this structure is navy blue wave 3, indicating the pair is in the third wave of a larger degree wave. This wave generally shows significant and pronounced movement, reflecting robust market momentum.
The direction for the next lower degrees is navy blue wave 4. This suggests that after the current wave completes, the market will transition into navy blue wave 4. The analysis notes that orange wave 4 has been completed at 155.721. This completion marks the end of a corrective phase and the beginning of the final impulsive wave in this sequence.
Currently, orange wave 5 is in play, indicating the market is expected to continue its upward movement. This wave is essential as it represents the last push in the current impulsive sequence before a potential correction or trend reversal might occur. Traders and analysts use this information to predict market behavior and make strategic decisions about their trading positions.
In summary, the USD/JPY pair is in an impulsive trend on the day chart, with orange wave 5 currently active. This follows the completion of orange wave 4 at 155.721, marking the shift into the final wave of the sequence. The analysis suggests the market is likely to continue its upward movement as part of navy blue wave 3, moving towards the completion of orange wave 5.
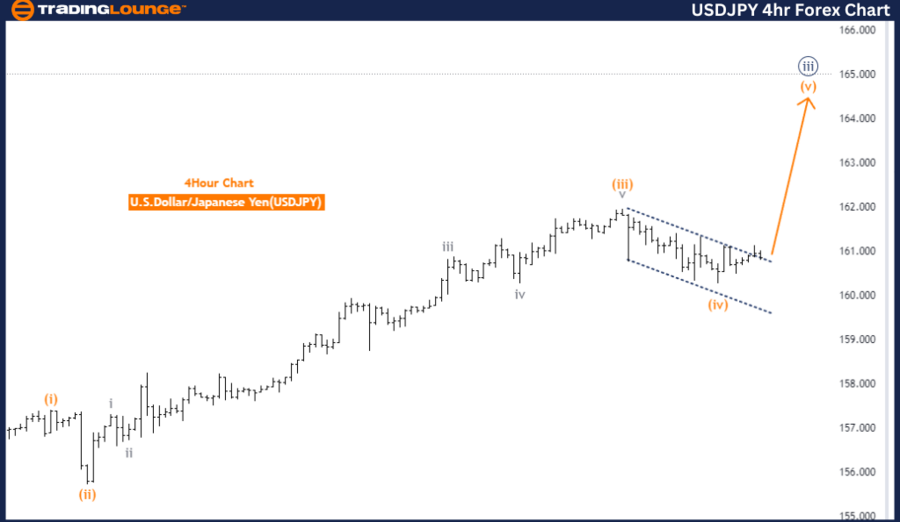
USD/JPY Elliott Wave Analysis - 4-Hour Chart
USD/JPY Elliott Wave Technical Analysis
Function: Trend
Mode: Impulsive
Structure: Orange Wave 5
Position: Navy Blue Wave 3
Direction Next Lower Degrees: Navy Blue Wave 4
Details: Orange wave 4 completed at 155.721, now orange wave 5 is in play.
The USD/JPY Elliott Wave Analysis on the 4-hour chart focuses on identifying the current trend and wave structure of the currency pair. The analysis designates the function as trend, indicating the market is moving in a specific direction rather than fluctuating randomly. The mode is classified as impulsive, which signifies strong and clear directional momentum.
The wave structure under scrutiny is orange wave 5, part of a larger wave pattern. Specifically, the position within the wave structure is navy blue wave 3, indicating the pair is in the third wave of the larger degree wave. This wave typically exhibits significant movement, reflecting strong market momentum.
The next lower degree of the wave structure is navy blue wave 4, suggesting that once the current wave completes, the market will transition to this next wave. The analysis highlights that orange wave 4 has been completed at the level of 155.721. This completion signals the end of a corrective phase and the beginning of the final impulsive wave within this sequence.
Currently, orange wave 5 is in play, indicating the market is expected to continue its upward movement. This wave is crucial as it represents the final push in the current impulsive sequence before a potential correction or trend reversal occurs. Traders and analysts use this information to anticipate market behavior and make informed decisions about entry and exit points.
In summary, the USD/JPY pair is in an impulsive trend on the 4-hour chart, with orange wave 5 currently active. This follows the completion of orange wave 4 at 155.721, marking the transition into the final wave of the sequence. The analysis indicates the market is likely to continue its upward movement as part of navy blue wave 3, moving towards the completion of orange wave 5.
Technical Analyst: Malik Awais
Source: visit Tradinglounge.com and learn From the Experts Join TradingLounge Here
Previous: EURGBP Elliott Wave Technical Analysis
Special Trial Offer - 0.76 Cents a Day for 3 Months! Click here
Access 7 Analysts Over 170 Markets Covered. Chat Room With Support