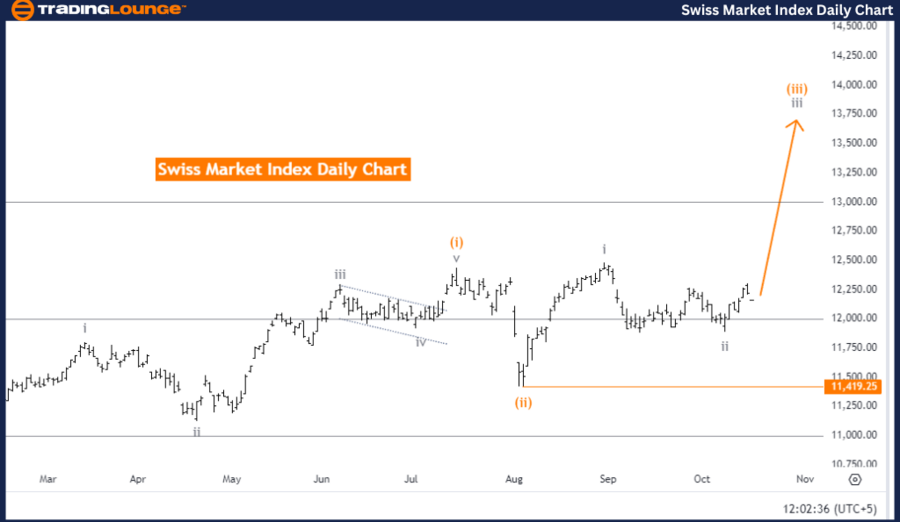
Swiss Market Index Elliott Wave Analysis - Trading Lounge Day Chart
Swiss Market Index Elliott Wave Technical Analysis
-
Function: Trend
-
Mode: Impulsive
-
Structure: Gray wave 3
-
Position: Orange wave 3
-
Direction Next Higher Degrees: Gray wave 3 (started)
-
Details: Gray wave 2 has been completed, and gray wave 3 is now in play.
- Wave Cancel Invalid Level: 11,419.25
The Swiss Market Index (SMI) Elliott Wave analysis for the daily chart indicates a bullish trend with an impulsive wave structure. The analysis centers on gray wave 3, which is progressing within the overall bullish trend. The market is advancing through orange wave 3, which is part of the broader gray wave 3.
Gray wave 2 has completed, and gray wave 3 is expected to drive the market higher. The impulsive nature of this wave signals a strong bullish momentum, suggesting further price increases. Impulsive waves are often associated with significant and sustained market movements in the direction of the trend.
The invalidation level for this Elliott Wave count is 11,419.25. If the market price falls below this level, the current wave structure would be invalidated, requiring a reassessment of the market analysis. However, as long as the price stays above this level, gray wave 3 is expected to push the market higher.
Summary:
The Swiss Market Index is currently in a strong upward trend, driven by gray wave 3. The completion of gray wave 2 sets the stage for further gains, as orange wave 3 continues within the larger wave structure. The key level to monitor is 11,419.25. A drop below this level would invalidate the current Elliott Wave count.
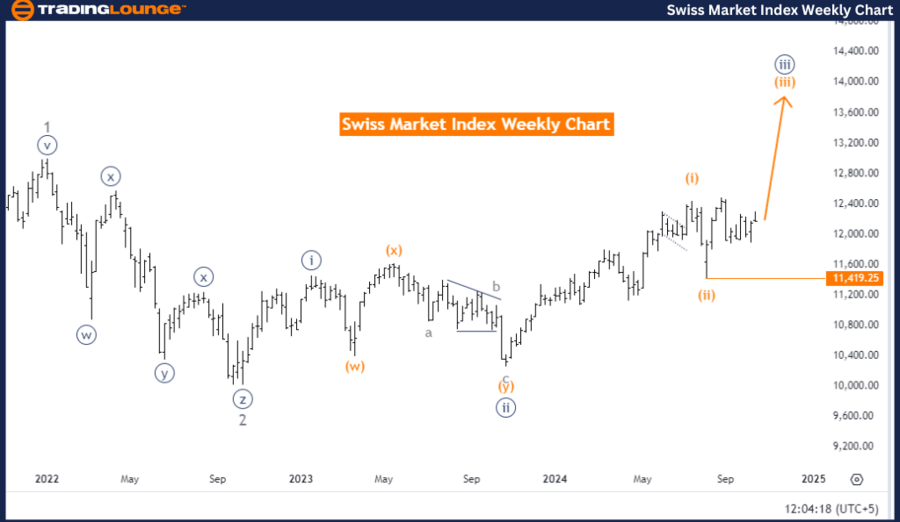
Swiss Market Index Elliott Wave Analysis - Trading Lounge Weekly Chart
Swiss Market Index Elliott Wave Technical Analysis
-
Function: Bullish Trend
-
Mode: Impulsive
-
Structure: Orange wave 3
-
Position: Navy Blue Wave 3
-
Direction Next Higher Degrees: Orange wave 3 (started)
-
Details: Orange Wave 2 has been completed, and now Orange Wave 3 is in play.
- Wave Cancel Invalid Level: 11,419.25
The Swiss Market Index (SMI) weekly chart Elliott Wave analysis highlights a bullish trend, with an impulsive wave structure. The focus is on orange wave 3, which is pushing the market higher within the overall bullish trend. This signals a continuation of the upward movement in line with long-term market expectations.
Orange wave 2 has been completed, and orange wave 3 is currently unfolding. The impulsive nature of this wave suggests that the market is positioned for further upward movement. This phase of the Elliott Wave cycle is pivotal, as substantial price advances are expected.
The analysis also points out that the market is within navy blue wave 3, part of the broader wave structure. This indicates further upward momentum in the market. The ongoing orange wave 3 is likely to push the market higher as it continues to unfold.
The invalidation level for this wave structure is 11,419.25. Should the market fall below this key level, the current wave count would be invalidated, requiring a reassessment of the analysis. However, as long as the price remains above 11,419.25, the bullish outlook will likely hold.
Summary:
The Swiss Market Index is experiencing a strong bullish trend, driven by orange wave 3. The completion of orange wave 2 supports the continuation of the upward movement within orange wave 3. The critical level to watch is 11,419.25. A price drop below this point would invalidate the current Elliott Wave structure.
Technical Analyst: Malik Awais
Source: visit Tradinglounge.com and learn From the Experts Join TradingLounge Here
Previous: NIKKEI 225 Elliott Wave Technical Analysis
VALUE Offer - Buy 1 Month & Get 3 Months!Click here
Access 7 Analysts Over 200 Markets Covered. Chat Room With Support