27Oct

JP Morgan Chase & Co.(JPM:NYSE) Elliott Wave Technical Analysis 27 October 23

JP Morgan Chase & Co., Elliott Wave Technical Analysis

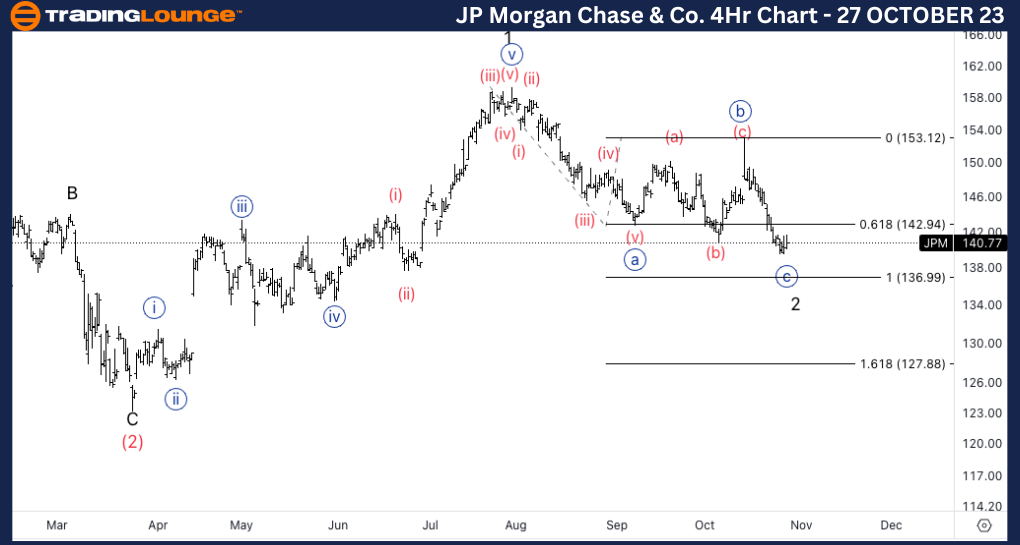
JP Morgan Chase & Co., (JPM:NYSE): 4H Chart 27 October 23

JPM Stock Market Analysis: We have been looking for further downside into wave 2 as we nearly hit 0.618 {c} vs. {a}. At this point we are looking for equality of {c} vs. {a} at 136$ to then resume higher.  

JPM Elliott Wave Count: Wave {c} of 2.  

JPM Technical Indicators: Below all averages.

JPM Trading Strategy: Looking for longs into wave 3.

TradingLounge Analyst: Alessio Barretta

Source: Tradinglounge.com get trial here!


JPM-Stock-4hr-chart-...


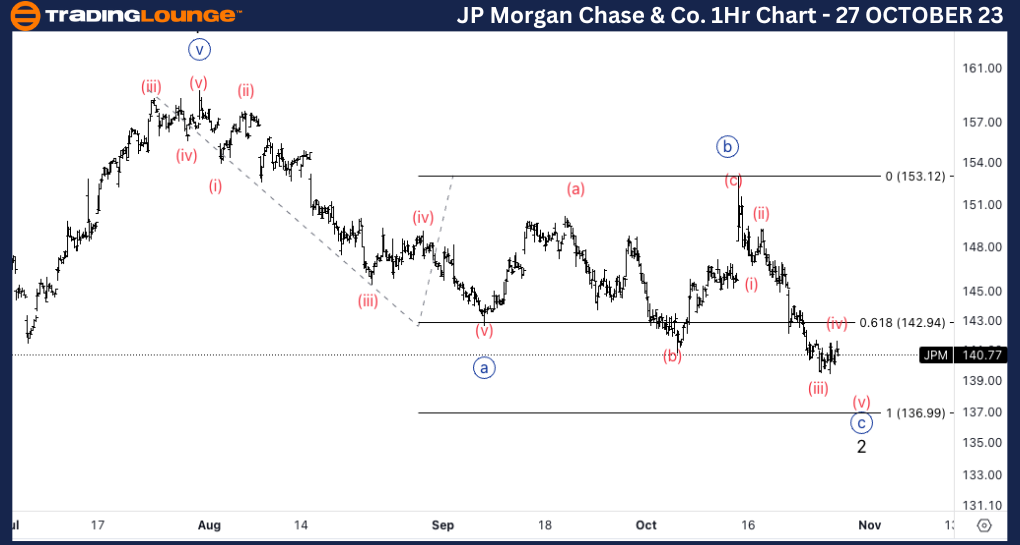
JP Morgan Chase & Co., JPM: 1-hour Chart 27 October 23

JP Morgan Chase & Co., Elliott Wave Technical Analysis

JPM Stock Market Analysis: Looking for one more low into wave (v) as we seem to have an incomplete five wave sequence in wave {c}.

JPM Elliott Wave count: Wave (iv) of {c}.  

JPM Technical Indicators: 20EMA as resistance

JPM Trading Strategy: Looking for shorts into wave (v).


JPM-Stock-1hr-chart-...

Related

Technical Analysis of Adani Green Energy Stock with Elliott Wave Insights: Understand Share Price and Trends Movements

Technical Analysis of Adani Green Energy Stock with Elliott Wave Insights: Understand Share Price and Trends Movements

Dive into the technical analysis of Adani Green Energy stock with Elliott Wave insights. Understand ...

Read More >
Cocoa Elliott Wave Technical Analysis: Breaking into New Highs Signals Strong Bullish Momentum

Cocoa Elliott Wave Technical Analysis: Breaking into New Highs Signals Strong Bullish Momentum

Cocoa's price action reflects a strong bullish sentiment, supported by analyses across daily and...

Read More >
Elliott Wave Analysis of GDX: Gold Miners ETF Forecast, Wave Count, Price Targets, and Trading Strategy Explained

Elliott Wave Analysis of GDX: Gold Miners ETF Forecast, Wave Count, Price Targets, and Trading Strategy Explained

This technical analysis covers the current Elliott Wave structure of the VanEck Gold Miners ETF (GDX...

Read More >
NIFTY 50 Elliott Wave Forecast Shows Ongoing Bullish Momentum with Wave 3 and 1 on Daily and Weekly Technical Charts

NIFTY 50 Elliott Wave Forecast Shows Ongoing Bullish Momentum with Wave 3 and 1 on Daily and Weekly Technical Charts

This article presents a comprehensive Elliott Wave analysis of the NIFTY 50 Index, utilising both da...

Read More >
Forex Analysis of Euro/U.S. Dollar EURUSD Using Elliott Wave Theory Provides Insights into the Current Market Trends

Forex Analysis of Euro/U.S. Dollar EURUSD Using Elliott Wave Theory Provides Insights into the Current Market Trends

This detailed analysis of EURUSD using Elliott Wave Theory provides insights into the current market...

Read More >

$1 for 2 Weeks

then $29 a month!

What a Special Offer!

Trade Recommendations

Unleash the power of deversified trading with our comprehensive portfolio, covering 250+ markets:

  • Stock Trades
  • Crypto Trades
  • Forex Trades
  • Commodity Trades
Elliott Wave Analysis

Gain a competitive edge with expert insights and AI-powered Elliott Wave charting into:

  • Global Indices
  • US Stocks & ASX Stocks
  • Forex & Crypto
  • Commodities
Top-Notch Trading Tools

Equip yourself with the tools of success:

  • Real-time Chat rooms
  • Elliott Wave Algorithm
  • Portfolio tools
  • TradingLevels
  • Screener
  • Trading Game
7 Elliott Wave Analysts

Stay ahead of the market with daily charts and insightful videos
Your secret to strategic trading!

JOIN HERE


Welcome to TradingLounge (ASIC A.R.No. 321187), specialists in trades, trading education and technical analysis, covering stocks, indices, commodities, forex and cryptocurrencies.

When you join TradingLounge you have access to everything we offer, including trade tools, educational content and a social platform to chat with like-minded investors.

Read more

@Copyright 2024 by tradinglounge.com

Contact Us

Australian no: 02 4787 6020

International no: +61 (2) 47876020

Pay with:

Find us on