Elliott Wave Analysis for JP Morgan Chase & Co. (JPM): A Comprehensive Guide
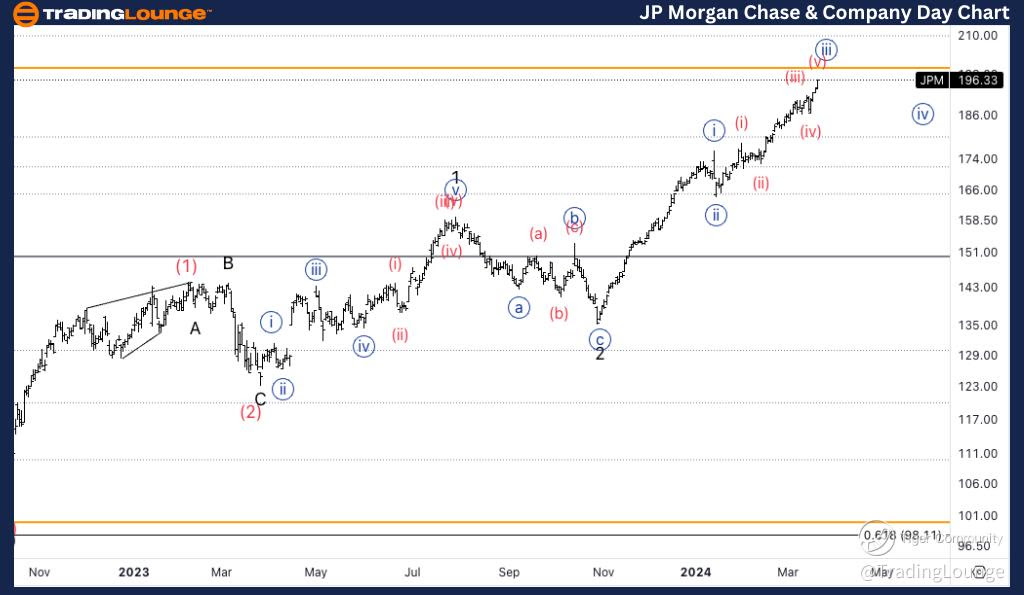
JPM Elliott Wave Analysis Trading Lounge Daily Chart
Elliott Wave Theory provides a structured framework for analyzing and predicting stock market trends by observing investor psychology manifested in waves. This article delves into the Elliott Wave analysis of JP Morgan Chase & Co. (JPM), focusing on its daily and 4-hour chart trends to offer insights into its future market movements.
JP Morgan Chase & Co., (JPM) Daily Chart Analysis
JPM Elliott Wave Technical Analysis
FUNCTION: Trend
MODE: Impulsive
STRUCTURE: Motive
POSITION: Wave 3 of (3).
DIRECTION: Upside in wave 3.
DETAILS: We are looking at a 1-2-1-2 from the 100$ lows, which seems to be confirmed by the steepness of the upside into what is now wave 3. Alternatively, we had a flat correction in wave (2) and it ends where Minor wave 2 currently is.

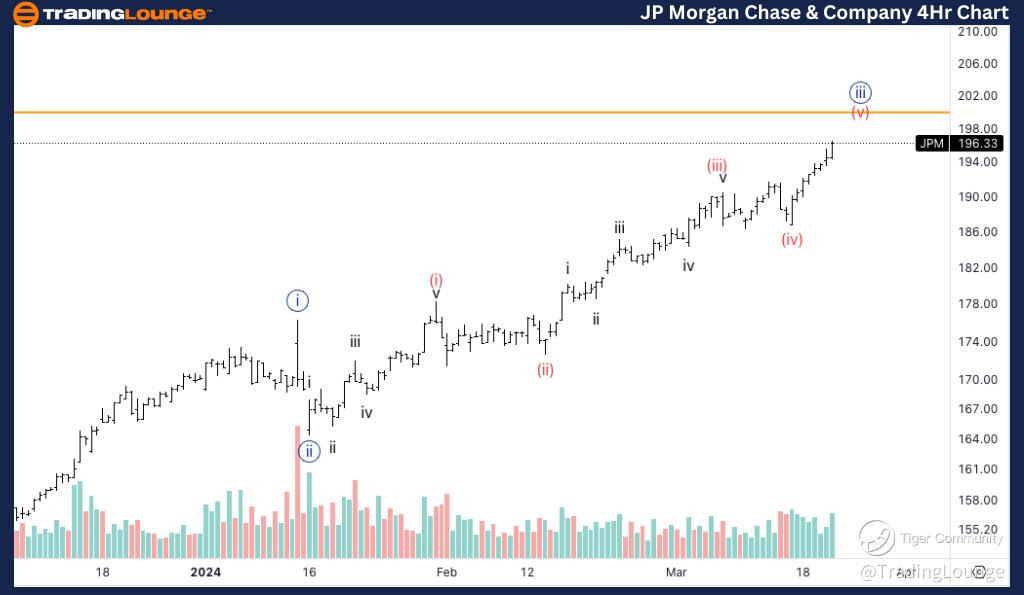
JPM Elliott Wave Analysis 4-Hour Chart Insights: Unraveling Short-Term Market Sentiments
JP Morgan Chase & Co., (JPM) 4Hr Chart Analysis
Elliott Wave Technical Analysis for JPM Stock
FUNCTION: Trend
MODE: Impulsive
STRUCTURE: Motive
POSITION: Minute wave {iii}
DIRECTION: Looking for the upside in wave (v).
DETAILS: We are targeting TL2 at 200$ as a wave {iii} target, the increasing volume could suggest sellers are entering the market, looking for 200$ to be reached first.
Conclusion: Harnessing Elliott Wave Theory for Market Edge
Elliott Wave Analysis offers a unique lens through which to view and anticipate market dynamics, providing a structured approach to understanding the phases of market trends. For JP Morgan Chase & Co., the current analysis indicates a bullish outlook, presenting opportunities for investors attuned to Elliott Wave patterns and market sentiment indicators.
Technical Analyst: Alessio Barretta
Source: visit Tradinglounge.com and learn From the Experts Join TradingLounge Here
See Previous: UnitedHealth Group Inc. (UNH)
TradingLounge Once Off SPECIAL DEAL: Here > 1 month Get 3 months.
