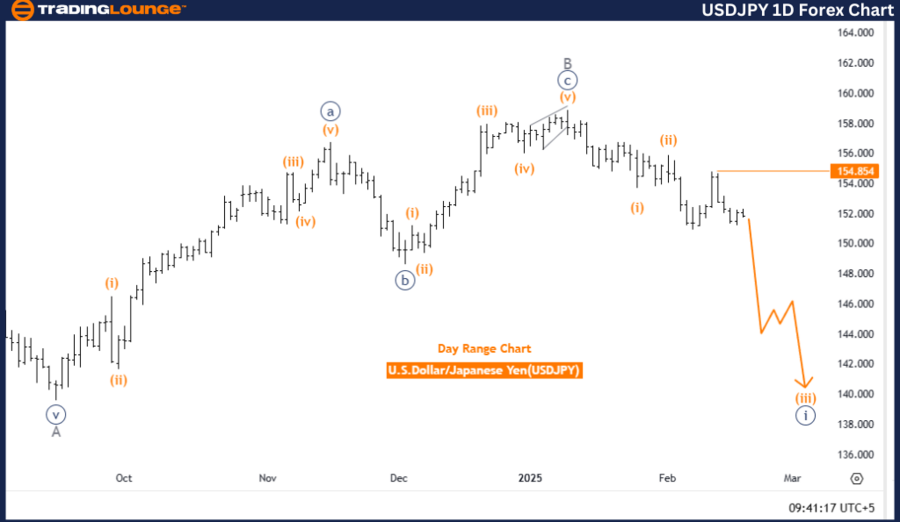
U.S. Dollar / Japanese Yen (USDJPY) Elliott Wave Analysis – TradingLounge Daily Chart
USDJPY Elliott Wave Technical Analysis
Function: Bearish Trend
Mode: Impulsive
Structure: Orange Wave 3
Position: Navy Blue Wave 1
Next Higher Degree Direction: Orange Wave 4
Details: Orange Wave 2 of Navy Blue Wave 1 appears completed, with Orange Wave 3 now in play.
Wave Cancellation Invalid Level: 154.854
USDJPY Elliott Wave Analysis Overview
The USDJPY daily chart indicates a bearish trend for the U.S. Dollar against the Japanese Yen, as per Elliott Wave Theory. This trading approach identifies repetitive wave structures in price action, allowing traders to anticipate future movements. The current market mode is impulsive, signaling a strong directional trend.
The wave structure under analysis is Orange Wave 3, forming part of a larger Navy Blue Wave 1. This suggests the bearish movement is still in an active downward phase.
Key Observations
✔ Completion of Orange Wave 2: Analysis suggests that Orange Wave 2 of Navy Blue Wave 1 has concluded.
✔ Activation of Orange Wave 3: Typically the strongest and longest wave in the Elliott sequence, Orange Wave 3 is now in motion, reinforcing a bearish sentiment.
✔ Anticipation of Orange Wave 4: Upon the completion of Orange Wave 3, the next higher-degree wave, Orange Wave 4, is expected to follow.
Key Level to Monitor
- Wave Cancellation Invalid Level: 154.854
- If USDJPY moves above 154.854, the current wave count would be invalidated, signaling a possible shift in market direction.
- This level serves as a crucial threshold for confirming the continuation of the bearish trend.
Conclusion
The USDJPY daily Elliott Wave analysis confirms the continuation of the bearish trend, with Orange Wave 3 actively progressing. The completion of Orange Wave 2 and the emergence of Orange Wave 3 indicate a strong downward momentum in the market.
Traders should closely monitor the 154.854 invalidation level, as a break above could challenge the current Elliott Wave structure. Given the present market conditions, traders should exercise caution and incorporate this analysis into their risk management strategy.
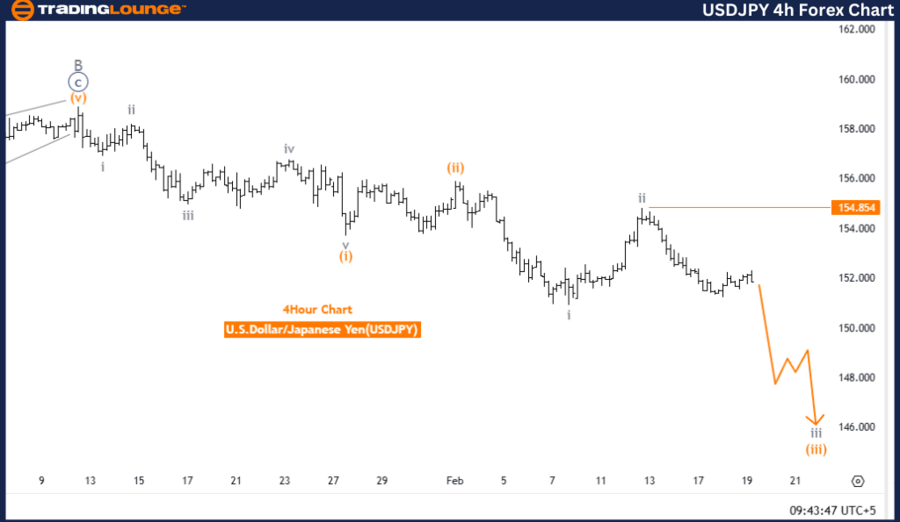
U.S. Dollar / Japanese Yen (USDJPY) Elliott Wave Analysis – TradingLounge 4-Hour Chart
USDJPY Elliott Wave Technical Analysis
Function: Bearish Trend
Mode: Impulsive
Structure: Gray Wave 3
Position: Orange Wave 3
Next Higher Degree Direction: Gray Wave 4
Details: Gray Wave 2 of Orange Wave 3 appears completed, with Gray Wave 3 now in play.
Wave Cancellation Invalid Level: 154.854
USDJPY Elliott Wave Analysis Overview
The USDJPY 4-hour chart also supports a bearish trend in the U.S. Dollar against the Japanese Yen, based on Elliott Wave Theory. This approach identifies repeating wave patterns in price action to anticipate potential movements. The market remains impulsive, highlighting strong directional momentum.
The current wave count places the market in Gray Wave 3, which is part of Orange Wave 3. This setup suggests that the bearish trend is experiencing a deeper downward extension.
Key Observations
✔ Completion of Gray Wave 2: The analysis suggests that Gray Wave 2 of Orange Wave 3 has concluded.
✔ Activation of Gray Wave 3: Gray Wave 3, typically the strongest and longest wave in an Elliott sequence, is now progressing, reinforcing further downside pressure.
✔ Anticipation of Gray Wave 4: Once Gray Wave 3 completes, the next higher-degree wave, Gray Wave 4, is expected to emerge.
Key Level to Monitor
- Wave Cancellation Invalid Level: 154.854
- A price movement above 154.854 would invalidate the current wave count, requiring a reassessment of the bearish outlook.
- This price level serves as a confirmation zone, indicating whether the bearish trend remains intact.
Conclusion
The USDJPY 4-hour Elliott Wave analysis supports a continuation of the bearish movement, with Gray Wave 3 currently in play. The completion of Gray Wave 2 and the initiation of Gray Wave 3 indicate a strong downward push.
Traders should watch the invalidation level at 154.854, as a break above this level could disrupt the existing bearish structure. Given the current market dynamics, traders are advised to stay cautious and use this Elliott Wave insight as part of their trading strategy.
Technical Analyst: Malik Awais
Source: visit Tradinglounge.com and learn From the Experts Join TradingLounge Here
Previous: EURGBP Elliott Wave Technical Analysis
VALUE Offer - Buy 1 Month & Get 3 Months!Click here
Access 7 Analysts Over 200 Markets Covered. Chat Room With Support