29Nov

Unlocking ASX Trading Success: ANZ GROUP HOLDINGS LIMITED - ANZ Elliott Wave Analysis & Elliott Wave Technical Forecast

ASX: ANZ GROUP HOLDINGS LIMITED - ANZ Elliott Wave Technical Analysis

Greetings, and welcome to our Elliott Wave analysis. Today, we delve into the Australian Stock Exchange (ASX) focusing on ANZ GROUP HOLDINGS LIMITED (ASX:ANZ). Our insights indicate a strong likelihood of ASX:ANZ experiencing significant downside movement in the near future.

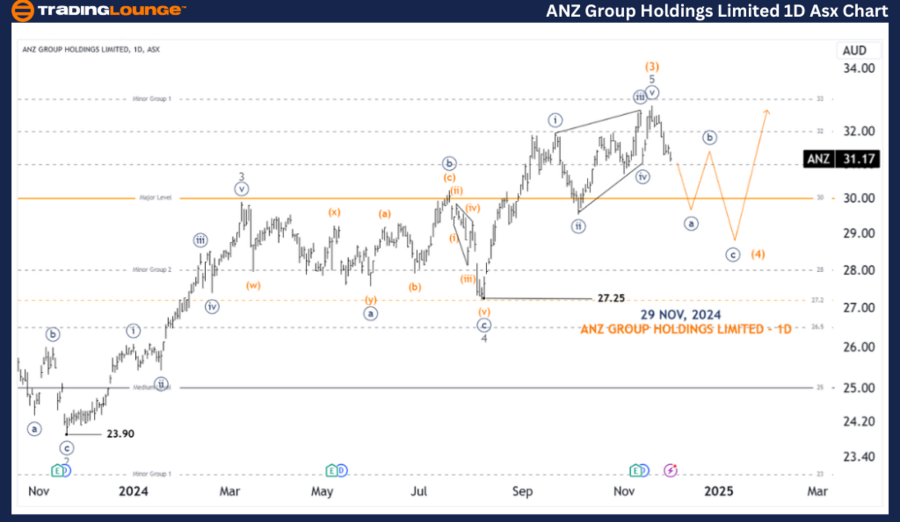
ASX: ANZ GROUP HOLDINGS LIMITED - ANZ 1D Chart (Semilog Scale) Analysis

Function: Major Trend (Intermediate degree, orange)

Mode: Motive

Structure: Impulse

Position: Wave ((a))-navy of Wave 4-orange

Details:

  • The recent completion of Wave (3)-orange suggests the beginning of Wave (4)-orange, which appears to be heading significantly lower, with a potential target around 27.25.
  • This development poses a risk to prior long trades, warranting a reconsideration of exit strategies with tighter stop-losses than initially planned.

Invalidation Point:

  • The end of Wave (3)-orange serves as the critical invalidation level for this analysis.

ANZ-GROUP-HOLDINGS-L...


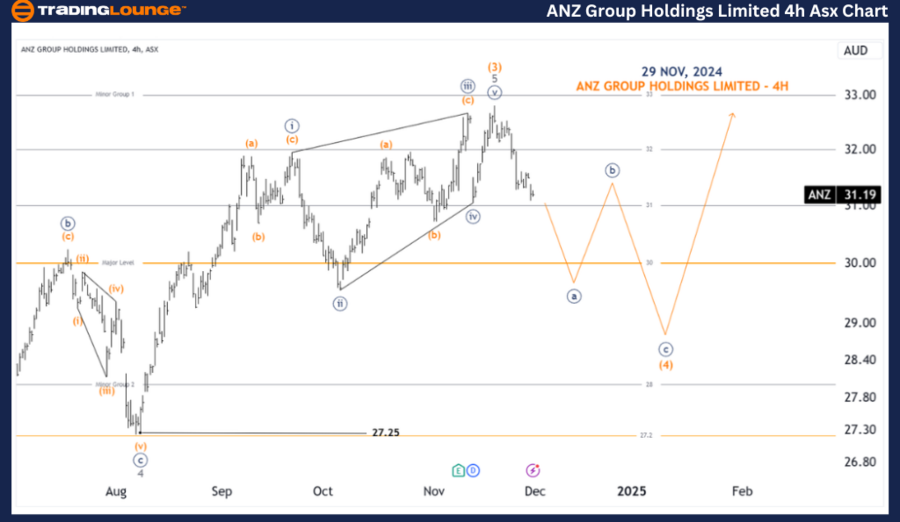
ASX: ANZ GROUP HOLDINGS LIMITED - ANZ 4-Hour Chart Analysis

Function: Major Trend (Intermediate degree, orange)

Mode: Motive

Structure: Impulse

Position: Wave ((a))-navy of Wave (4)-orange

Details:

  • The prolonged and weak development of the 5-grey wave suggests a Diagonal Ending pattern, further strengthening the probability of a sharp decline in ASX:ANZ prices.
  • The projected target remains near the 27.25 low, consistent with the daily chart's outlook.

Invalidation Point:

  • Similar to the daily chart, the end of Wave (3)-orange marks the invalidation threshold.

Technical Analyst: Hua (Shane) Cuong, CEWA-M (Master’s Designation).

Source: visit Tradinglounge.com and learn From the Experts Join TradingLounge Here 

See Previous: Sonic Healthcare Limited - SHL Elliott Wave Technical Analysis

VALUE Offer - Buy 1 Month & Get 3 Months!Click here

Access 7 Analysts Over 200 Markets Covered. Chat Room With Support

ANZ-GROUP-HOLDINGS-L...


Conclusion

Our Elliott Wave analysis for ASX: ANZ GROUP HOLDINGS LIMITED highlights key contextual and short-term trends, offering actionable insights for traders. Specific price targets and invalidation points aim to increase confidence in our wave count, enhancing decision-making. Combining these elements ensures a clear and objective perspective on market dynamics, empowering traders to navigate trends effectively.

Related

MicroStrategy Inc. (MSTR) Elliott Wave Technical Analysis: Fibonacci Retracement, Wave Counts, and 2024 Price Forecasts

MicroStrategy Inc. (MSTR) Elliott Wave Technical Analysis: Fibonacci Retracement, Wave Counts, and 2024 Price Forecasts

MSTR stock analysis dives into MicroStrategy’s Elliott Wave patterns on daily and hourly charts. Ga...

Read More >
Dell Technologies Stock Alert: DELL Elliott Wave Analysis Predicts Further Downside – Bearish Trend and Key Levels to Watch!

Dell Technologies Stock Alert: DELL Elliott Wave Analysis Predicts Further Downside – Bearish Trend and Key Levels to Watch!

Dell Technologies (DELL) is in a corrective phase, forming a five-wave structure within wave C of (4...

Read More >
ASX: CAR Elliott Wave Technical Forecast Shows Bullish Wave 5 Setup with Key Support at 28.40 and Upside Target Near 41.30

ASX: CAR Elliott Wave Technical Forecast Shows Bullish Wave 5 Setup with Key Support at 28.40 and Upside Target Near 41.30

Elliott Wave analysis for CAR GROUP LIMITED (ASX: CAR) suggests a bullish continuation from wave (4)...

Read More >
MicroStrategy Inc. (MSTR) Elliott Wave Forecast Shows Bullish Trend With Fibonacci Target

MicroStrategy Inc. (MSTR) Elliott Wave Forecast Shows Bullish Trend With Fibonacci Target

MicroStrategy (MSTR) is unfolding a bullish five-wave Elliott structure, nearing a major top before ...

Read More >
Elliott Wave Technical Analysis of the Dow Jones Industrial Average (DJI), Offering Valuable Insights for Investors and Traders

Elliott Wave Technical Analysis of the Dow Jones Industrial Average (DJI), Offering Valuable Insights for Investors and Traders

This comprehensive guide provides a thorough Elliott Wave Analysis of the Dow Jones Industrial Avera...

Read More >
Bovespa Index Elliott Wave Count Signals Bullish Market Trend With Strong Impulse Waves and Key Technical Support Levels

Bovespa Index Elliott Wave Count Signals Bullish Market Trend With Strong Impulse Waves and Key Technical Support Levels

Discover a bullish Elliott Wave analysis of the Bovespa Index with clear daily and weekly wave count...

Read More >

$1 for 2 Weeks

then $29 a month!

What a Special Offer!

Trade Recommendations

Unleash the power of deversified trading with our comprehensive portfolio, covering 250+ markets:

  • Stock Trades
  • Crypto Trades
  • Forex Trades
  • Commodity Trades
Elliott Wave Analysis

Gain a competitive edge with expert insights and AI-powered Elliott Wave charting into:

  • Global Indices
  • US Stocks & ASX Stocks
  • Forex & Crypto
  • Commodities
Top-Notch Trading Tools

Equip yourself with the tools of success:

  • Real-time Chat rooms
  • Elliott Wave Algorithm
  • Portfolio tools
  • TradingLevels
  • Screener
  • Trading Game
7 Elliott Wave Analysts

Stay ahead of the market with daily charts and insightful videos
Your secret to strategic trading!

JOIN HERE


Welcome to TradingLounge (ASIC A.R.No. 321187), specialists in trades, trading education and technical analysis, covering stocks, indices, commodities, forex and cryptocurrencies.

When you join TradingLounge you have access to everything we offer, including trade tools, educational content and a social platform to chat with like-minded investors.

Read more

@Copyright 2024 by tradinglounge.com

Contact Us

Australian no: 02 4787 6020

International no: +61 (2) 47876020

Pay with:

Find us on