27Jun

NEWMONT CORPORATION - NEM Elliott Wave Technical Analysis Reveals Bullish Impulse Wave With Key Targets and Invalidation Levels

ASX: NEWMONT CORPORATION – NEM Elliott Wave Technical Analysis - TradingLounge 

Welcome to our latest Elliott Wave review of Newmont Corporation (ASX:NEM). Based on our current wave count, ASX:NEM appears to be in the midst of a third wave advance. This update provides clearly defined target zones and a precise invalidation level, allowing traders to recognize when the current bullish momentum may either continue or shift.


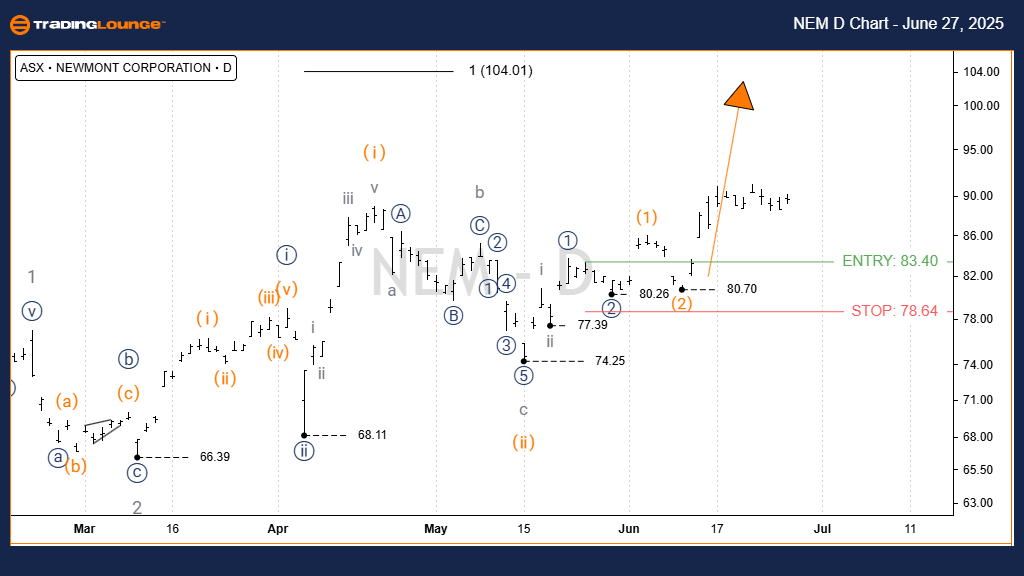
ASX: NEWMONT CORPORATION – NEM Elliott Wave Technical Forecast 1D Chart (Semilog Scale) Breakdown

Function: Identifying primary trend at Minor degree (grey)

Mode: Motive structure

Wave Type: Impulse formation

Wave Count: iii) - orange within iii)) - navy of 3 - grey

Key Observations:

Wave ii) - orange likely bottomed at 74.25, forming a complete zigzag labeled a-b-c (grey).

Since that low, wave iii) - orange has been advancing toward the projected 100.00 level.

Critical Invalidation Point: 74.25

NEWMONT-1d-asx-chart...


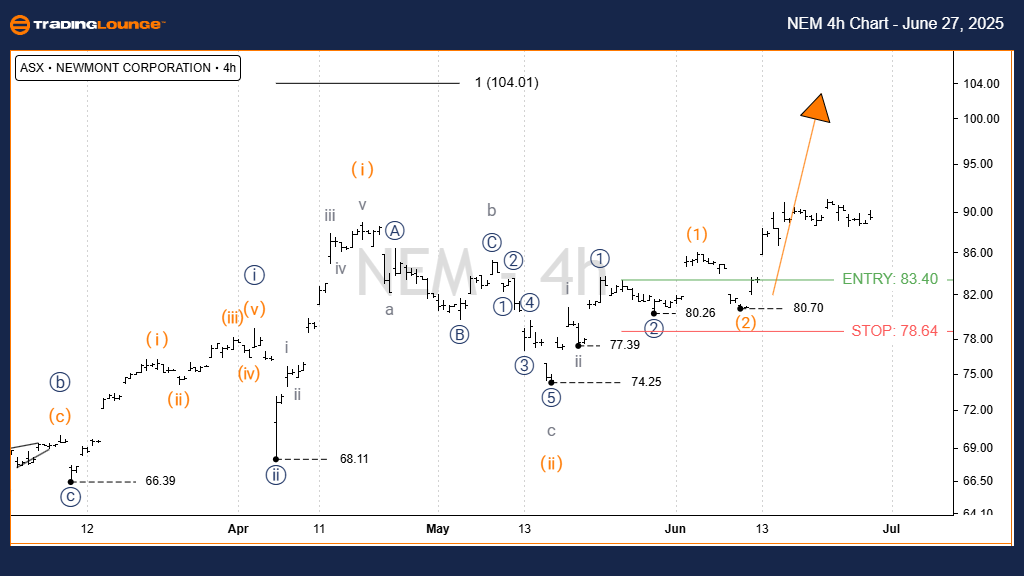
ASX: NEWMONT CORPORATION – NEM 4-Hour Elliott Wave Chart Insight

Function: Mapping the major uptrend at Minor degree (grey)

Mode: Motive wave pattern

Wave Type: Impulse continuation

Wave Count: iii) - orange of ((iii)) - navy within 3 - grey

Analysis Highlights:

Our 4H chart aligns with the daily structure, confirming the impulsive wave iii) - orange is still progressing.

Near-term objective is a rally towards 90.00, with the broader target remaining around 100.00.

Key Invalidation Level: 74.25

Technical Analyst: Hua (Shane) Cuong, CEWA-M (Master’s Designation).

Source: Visit Tradinglounge.com and learn from the Experts. Join TradingLounge Here 

See Previous: COLES GROUP LIMITED – COL Elliott Wave Technical Analysis

VALUE Offer - Buy 1 Month & Get 3 Months!Click here

Access 7 Analysts Over 200 Markets Covered. Chat Room With Support

NEWMONT-4h-asx-chart...


Technical Summary:

This Elliott Wave overview on ASX: NEWMONT CORPORATION – NEM outlines both short-term and long-term wave perspectives. Clear target and invalidation zones provide traders with high-probability trade ideas. Our structured approach aims to enhance clarity and boost confidence in decision-making through disciplined technical evaluation.

Related

GRASIM Industries Bullish Elliott Wave 3 Forecast: Indian Stock Technical Chart Setup with Key Support and Strong Uptrend Signal

GRASIM Industries Bullish Elliott Wave 3 Forecast: Indian Stock Technical Chart Setup with Key Support and Strong Uptrend Signal

GRASIM Industries shows a bullish Elliott Wave structure with wave 3 now active, suggesting strong u...

Read More >
Identified support levels and predicted price targets Analog Devices Inc. Stock: ADI Elliott Wave Technical Analysis

Identified support levels and predicted price targets Analog Devices Inc. Stock: ADI Elliott Wave Technical Analysis

This comprehensive Elliott Wave analysis of Analog Devices Inc. (ADI) for June 2024 offers a deep di...

Read More >
Market Indices in Focus: Elliott Wave Analysis and Trade Strategy Amid S&P 500 Decline

Market Indices in Focus: Elliott Wave Analysis and Trade Strategy Amid S&P 500 Decline

The S&P 500 saw its biggest drop since August as U.S. manufacturing continued to contract for the fi...

Read More >
Euro/British Pound(EURGBP) 4 Hour Chart EURGBP Elliott Wave Technical Analysis 13 October 23

Euro/British Pound(EURGBP) 4 Hour Chart EURGBP Elliott Wave Technical Analysis 13 October 23

The EUR/GBP Elliott Wave Analysis for 13 October 23, serves as a valuable guide for traders and inve...

Read More >
Soybeans Commodity Elliott Wave Technical Analysis: Detailing the Market Trends, and Price Forecasts

Soybeans Commodity Elliott Wave Technical Analysis: Detailing the Market Trends, and Price Forecasts

This article provides a comprehensive Elliott Wave Analysis for soybeans, detailing the market trend...

Read More >
VeChain (VETUSD) Elliott Wave Analysis: Identifying Profitable Trends and Trading Strategies

VeChain (VETUSD) Elliott Wave Analysis: Identifying Profitable Trends and Trading Strategies

VeChain (VETUSD) trading opportunities with Elliott Wave analysis provided by TradingLounge. Explore...

Read More >

$1 for 2 Weeks

then $29 a month!

What a Special Offer!

Trade Recommendations

Unleash the power of deversified trading with our comprehensive portfolio, covering 250+ markets:

  • Stock Trades
  • Crypto Trades
  • Forex Trades
  • Commodity Trades
Elliott Wave Analysis

Gain a competitive edge with expert insights and AI-powered Elliott Wave charting into:

  • Global Indices
  • US Stocks & ASX Stocks
  • Forex & Crypto
  • Commodities
Top-Notch Trading Tools

Equip yourself with the tools of success:

  • Real-time Chat rooms
  • Elliott Wave Algorithm
  • Portfolio tools
  • TradingLevels
  • Screener
  • Trading Game
7 Elliott Wave Analysts

Stay ahead of the market with daily charts and insightful videos
Your secret to strategic trading!

JOIN HERE


Welcome to TradingLounge (ASIC A.R.No. 321187), specialists in trades, trading education and technical analysis, covering stocks, indices, commodities, forex and cryptocurrencies.

When you join TradingLounge you have access to everything we offer, including trade tools, educational content and a social platform to chat with like-minded investors.

Read more

@Copyright 2024 by tradinglounge.com

Contact Us

Australian no: 02 4787 6020

International no: +61 (2) 47876020

Pay with:

Find us on