NZDUSD Elliott Wave Analysis - TradingLounge Day Chart
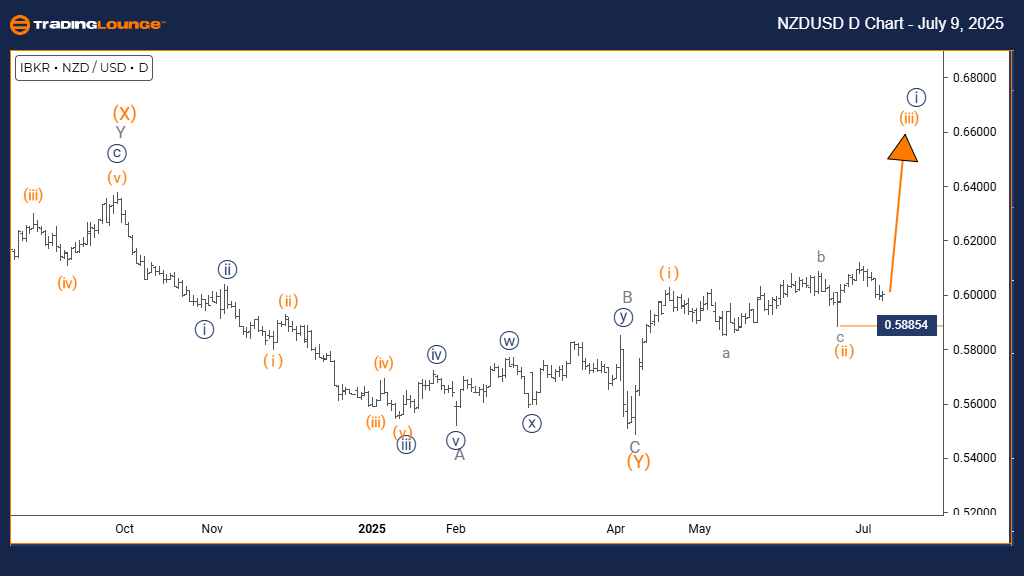
New Zealand Dollar/ U.S. Dollar (NZDUSD) Day Chart Analysis
NZDUSD Elliott Wave Technical Analysis
FUNCTION: Bullish Trend
MODE: Impulsive
STRUCTURE: Orange Wave 3
POSITION: Navy Blue Wave 1
DIRECTION NEXT LOWER DEGREES: Orange Wave 4
DETAILS: Completion of Orange Wave 2 confirmed; Orange Wave 3 currently advancing.
Wave Cancel Invalid Level: 0.58854
The daily NZDUSD chart reflects a clear bullish Elliott Wave structure. Currently, price action demonstrates an impulsive movement, attributed to orange wave 3, nested within navy blue wave 1. This setup signals the early phase of a potentially broader bullish trend.
The next anticipated move is a corrective orange wave 4, following the current progress of wave 3. Recent indicators confirm the end of orange wave 2, allowing wave 3—the most dynamic in Elliott Wave theory—to develop. The strength of the impulsive wave suggests solid bullish momentum driven by consistent buying interest.
The key invalidation level is set at 0.58854. A drop below this mark would invalidate the current wave interpretation and may imply a trend reversal. So long as the price remains above this threshold, the market retains a bullish bias, with expectations of continued impulsive action.
Upon completion of orange wave 3, orange wave 4 should emerge as a corrective phase. Monitoring the daily chart provides macro-level insights into NZDUSD’s direction, helping traders focus on more strategic, trend-aligned decisions.
Wave 3 historically produces the most powerful market moves in Elliott Wave sequences. As this pattern unfolds, closely observing price levels becomes crucial for identifying key trading opportunities and resistance zones.
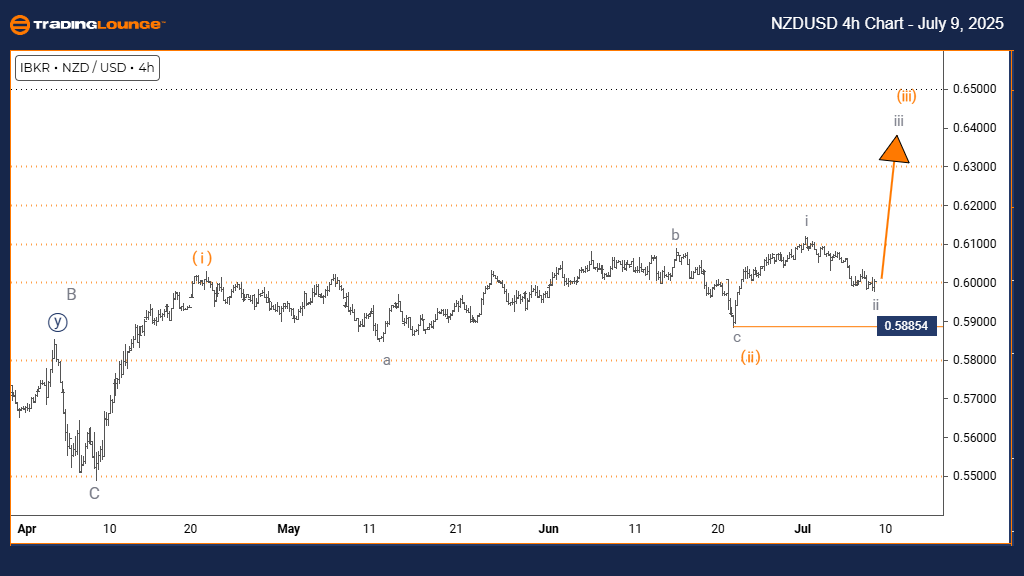
New Zealand Dollar/ U.S. Dollar (NZDUSD) 4-Hour Chart Analysis
NZDUSD Elliott Wave Technical Analysis
FUNCTION: Bullish Trend
MODE: Impulsive
STRUCTURE: Gray Wave 3
POSITION: Orange Wave 3
DIRECTION NEXT HIGHER DEGREES: Gray Wave 3 (In Progress)
DETAILS: Gray Wave 2 has likely ended; Gray Wave 3 now underway.
Wave Cancel Invalid Level: 0.58854
The 4-hour NZDUSD chart reinforces a bullish market structure through Elliott Wave analysis. Price activity is forming an impulsive gray wave 3, situated within a broader orange wave 3, signaling enhanced upside strength in this timeframe.
Following the apparent conclusion of gray wave 2, the pair is advancing within gray wave 3—typically characterized by strong upward movement. The defined invalidation threshold at 0.58854 remains essential. A decline below this would challenge the current wave count and potentially shift the directional bias.
Given the positioning within orange wave 3, the structure aligns with a high-momentum phase, often supported by increasing demand and persistent bullish flows. As long as the price remains above the invalidation point, the technical outlook stays positive.
Looking ahead, gray wave 4 is projected to emerge after the peak of wave 3. However, the current priority is tracking the ongoing impulsive behavior of wave 3. This timeframe offers short- to mid-term guidance, helping traders align entries with momentum-driven trends.
In summary, the 4-hour Elliott Wave reading continues to support a bullish scenario for NZDUSD. The sustained climb within wave 3 presents potential long-side opportunities. As gray wave 2 completes, the stage is set for possible further gains, as long as the structure remains intact and price holds above 0.58854. Maintaining a close watch on wave development helps manage risk and optimize trade positioning around critical technical zones.
Technical Analyst: Malik Awais
Source: Visit Tradinglounge.com and learn from the Experts. Join TradingLounge Here
Previous: GBPUSD Elliott Wave Technical Analysis
VALUE Offer - $1 for 2 Weeks then $29 a month!Click here
Access 7 Analysts Over 200 Markets Covered. Chat Room With Support