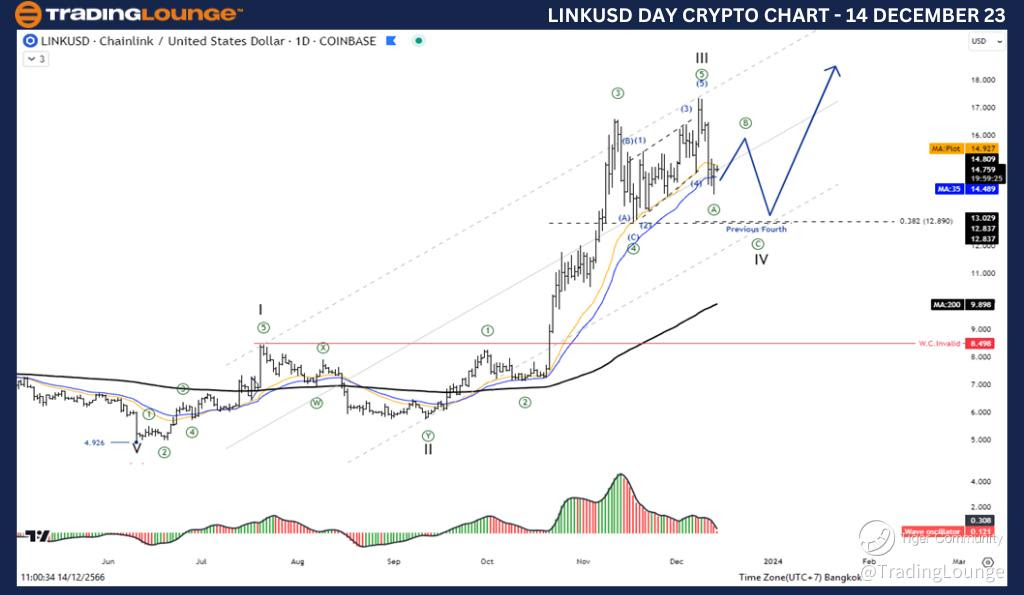
Elliott Wave Analysis TradingLounge Daily Chart, 14 December 23,
ChainLink / U.S. dollar(LINKUSD)
LINKUSD Elliott Wave Technical Analysis
Function: Counter Trend
Mode: Corrective
Structure: Zigzag
Position: Wave B
Direction Next higher Degrees: Wave IV of Impulse
Wave Cancel invalid Level: 8.259
Details: the three-wave Corrective of wave 4
ChainLink / U.S. dollar(LINKUSD)Trading Strategy: Chainlink remains in an uptrend. But it looks like wave 3 is complete at the 17.300 level and the price is entering a wave 4 correction, likely down to test the 12.890 level as an important support level. So wait for the correction of wave 4 to complete to rejoin the trend in wave 5.
ChainLink / U.S. dollar(LINKUSD)Technical Indicators: The price is above the MA200 indicating an uptrend, Wave Oscillators a Bullish Momentum.
TradingLounge Analyst: Kittiampon Somboonsod, CEWA
Source : Tradinglounge.com get trial here!
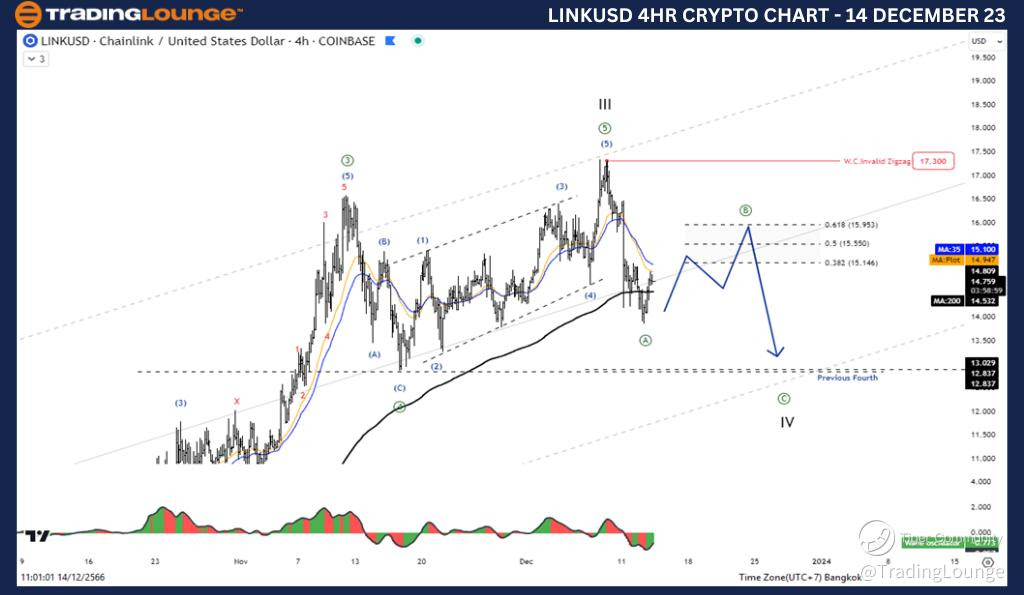
Elliott Wave Analysis TradingLounge 4H Chart, 14 December 23,
ChainLink / U.S. dollar(LINKUSD)
LINKUSD Elliott Wave Technical Analysis
Function: Counter Trend
Mode: Corrective
Structure: Zigzag
Position: Wave B
Direction Next higher Degrees: Wave IV of Impulse
Wave Cancel invalid Level: 8.259
Details: the three-wave Corrective of wave 4
ChainLink / U.S. dollar(LINKUSD)Trading Strategy: Chainlink remains in an uptrend. But it looks like wave 3 is complete at the 17.300 level and the price is entering a wave 4 correction, likely down to test the 12.890 level as an important support level. So wait for the correction of wave 4 to complete to rejoin the trend in wave 5.
ChainLink / U.S. dollar(LINKUSD)Technical Indicators: The price is above the MA200 indicating an uptrend, Wave Oscillators a Bullish Momentum.