13Nov

Our Detailed Elliott Wave Technical Analysis of ASX: SCG Offers Insights into Scentre Group's Stock Movements

ASX: SCENTRE GROUP – SCG Elliott Wave Analysis TradingLounge Day Chart

Greetings! In today’s Elliott Wave analysis, we focus on SCENTRE GROUP (SCG) listed on the Australian Stock Exchange (ASX). Our study suggests a potential bullish market scenario developing in Wave 3-grey for SCG.ASX. However, further confirmation is required before the pattern unfolds completely.

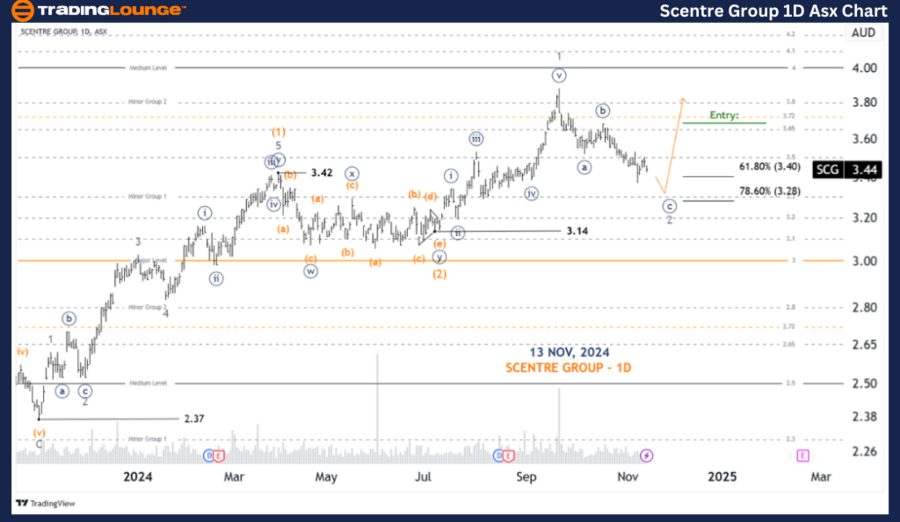
ASX: SCENTRE GROUP – SCG 1D Chart (Semilog Scale) Analysis

SCG Elliott Wave Technical Analysis

Function: Major Trend (Intermediate Degree, Orange)

Mode: Motive

Structure: Impulse

Position: Wave 2-grey of Wave (3)-orange

Details: Wave 1-grey has completed, and Wave 2-grey is in progress, expected to push lower. A possible target range is between 3.40 and 3.28. If the price falls below 3.14, it will necessitate a reevaluation of the wave structure. On the other hand, if the price moves above the end of Wave ((b))-navy, it indicates the beginning of Wave 3-grey.

Invalidation Point: 3.14

SCENTRE-GROUP-1D-Asx...


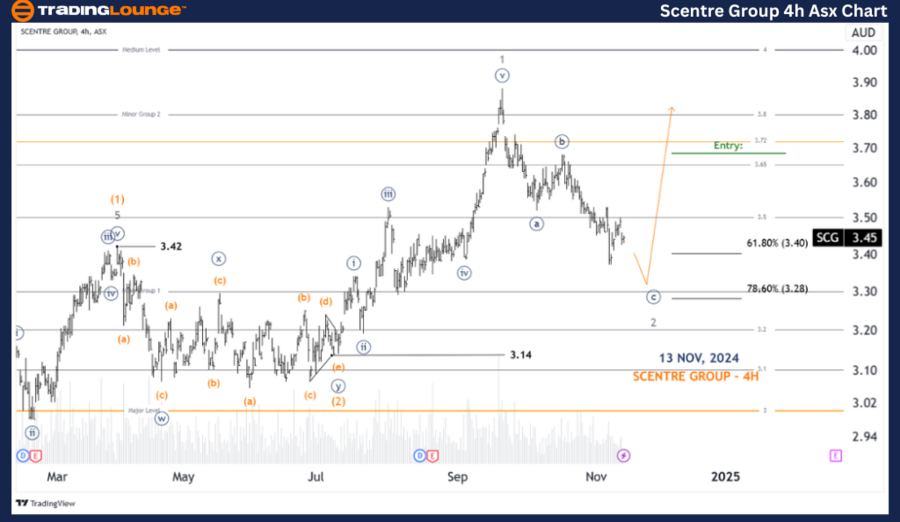
ASX: SCENTRE GROUP – SCG 4-Hour Chart Analysis

Function: Major Trend (Minute Degree, Navy)

Mode: Motive

Structure: Impulse

Position: Wave ((c))-navy of Wave 2-grey

Details:
Wave 2-grey is unfolding as a Zigzag labeled ((a))((b))((c))-navy. Currently, Wave ((c))-navy is extending lower. A break below 3.28 would confirm increased bearish pressure and demand reassessment. Conversely, a move above Wave ((b))-navy suggests that Wave 3-grey is ready to take shape.

Invalidation Point: 3.14

Technical Analyst: Hua (Shane) Cuong, CEWA-M (Master’s Designation).

Source: visit Tradinglounge.com and learn From the Experts Join TradingLounge Here 

See Previous: QBE INSURANCE GROUP LIMITED Elliott Wave Technical Analysis 

VALUE Offer - Buy 1 Month & Get 3 Months!Click here

Access 7 Analysts Over 200 Markets Covered. Chat Room With Support

SCENTRE-GROUP-4h-Asx...


Conclusion

Our Elliott Wave analysis for ASX: SCENTRE GROUP – SCG provides actionable insights into ongoing trends and key price levels. The identified validation and invalidation points serve as crucial indicators for confirming our wave counts and their implications for market movements. These details offer traders and investors a professional framework to navigate market opportunities effectively.

Related

Commodity Market Elliott Wave Analysis: Insights on Bitcoin, Bonds, Yields, and More

Commodity Market Elliott Wave Analysis: Insights on Bitcoin, Bonds, Yields, and More

Unlocking Market Trends: Discover Elliott Wave Insights on Bitcoin, Bonds, Yields, and More. Stay Ah...

Read More >
Elliott Wave Technical Analysis of the Dow Jones Industrial Average (DJI), Offering Valuable Insights for Investors and Traders

Elliott Wave Technical Analysis of the Dow Jones Industrial Average (DJI), Offering Valuable Insights for Investors and Traders

This comprehensive guide provides a thorough Elliott Wave Analysis of the Dow Jones Industrial Avera...

Read More >
Information on Commodity Market Dynamics and Price Forecasts: Coffee Elliott Wave Technical Analysis

Information on Commodity Market Dynamics and Price Forecasts: Coffee Elliott Wave Technical Analysis

This article provides a comprehensive Elliott Wave Analysis of Coffee commodities. It covers technic...

Read More >
COAL INDIA Indian Stocks Elliott Wave Technical Analysis: Daily & Weekly Stock Forecast with Key Wave Signals

COAL INDIA Indian Stocks Elliott Wave Technical Analysis: Daily & Weekly Stock Forecast with Key Wave Signals

This article delivers a complete Elliott Wave analysis of COAL INDIA, detailing the stock's corr...

Read More >
Gold Commodity Price Forecast Using Elliott Wave: 2024 Bullish Trend Points to $3500 Target After Pullback – When to Buy

Gold Commodity Price Forecast Using Elliott Wave: 2024 Bullish Trend Points to $3500 Target After Pullback – When to Buy

Gold remains bullish with Elliott Wave analysis forecasting a rally to $3200–$3500. Discover key le...

Read More >
Unlocking ASX Trading Success: COCHLEAR LIMITED - COH Stock Analysis & Elliott Wave Technical Forecast

Unlocking ASX Trading Success: COCHLEAR LIMITED - COH Stock Analysis & Elliott Wave Technical Forecast

Our detailed Elliott Wave analysis provides an examination of Cochlear Limited's (COH) stock per...

Read More >

Buy 1 Month

Get 3 Months!

Special Offer:

Trade Recommendations

Unleash the power of deversified trading with our comprehensive portfolio, covering:

  • Stock Trades
  • Crypto Trades
  • Forex Trades
  • Commodity Trades
Elliott Wave Analysis

Gain a competive edge with expert insights in to:

  • Global Indices
  • US Stocks & ASX Stocks
  • Forex & Crypto
  • Commodities
Top-Notch Trading Tools

Equip yourself with the tools of success:

  • Social Chat
  • Elliott Wave Algorithm
  • Screener
  • TradingLevels
  • Trading Game
7 Elliott Wave Analysts

Stay ahead of the market with daily charts and insightful videos
-Your secret to strategic trading!

JOIN HERE


Welcome to TradingLounge (ASIC A.R.No. 321187), specialists in trades, trading education and technical analysis, covering stocks, indices, commodities, forex and cryptocurrencies.

When you join TradingLounge you have access to everything we offer, including trade tools, educational content and a social platform to chat with like-minded investors.

Read more

@Copyright 2024 by tradinglounge.com

Contact Us

Australian no: 02 4787 6020

International no: +61 (2) 47876020

Pay with:

Find us on