12Nov

Unlocking ASX Trading Success: QBE INSURANCE GROUP LIMITED – QBE Stock Analysis & Elliott Wave Technical Forecast

ASX: QBE INSURANCE GROUP LIMITED – QBE Elliott Wave Technical Analysis TradingLounge

Introduction:
Welcome to our Elliott Wave analysis for the Australian Stock Exchange (ASX), featuring QBE INSURANCE GROUP LIMITED (ASX: QBE). Our forecast indicates continued growth in QBE, with the progression of wave (iii)-orange, followed by wave (v)-orange in the broader trend structure.

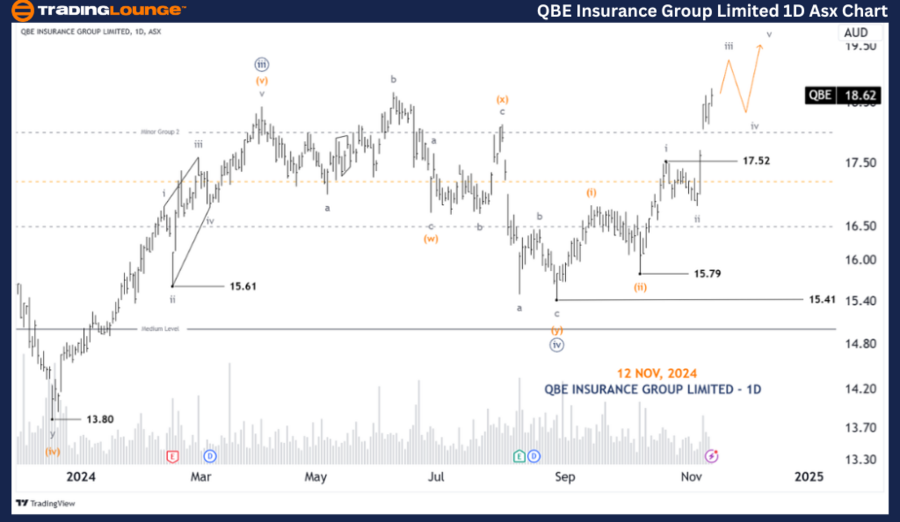
ASX: QBE INSURANCE GROUP LIMITED – QBE 1-Day Chart Analysis (Semilog Scale)

QBE Elliott Wave Technical Analysis

Function: Major trend (Subminuette degree, gray)

Mode: Motive

Structure: Impulse

Position: Wave iii-gray of Wave (iii)-orange of Wave ((v))-navy

Details:
Wave iii-gray of wave (iii)-orange of wave ((v))-navy is advancing higher. For this bullish outlook to remain intact, the price must stay above 17.52, as wave 4 cannot overlap wave 1.

Invalidation Point: 17.52

QBE-INSURANCE-GROUP-...


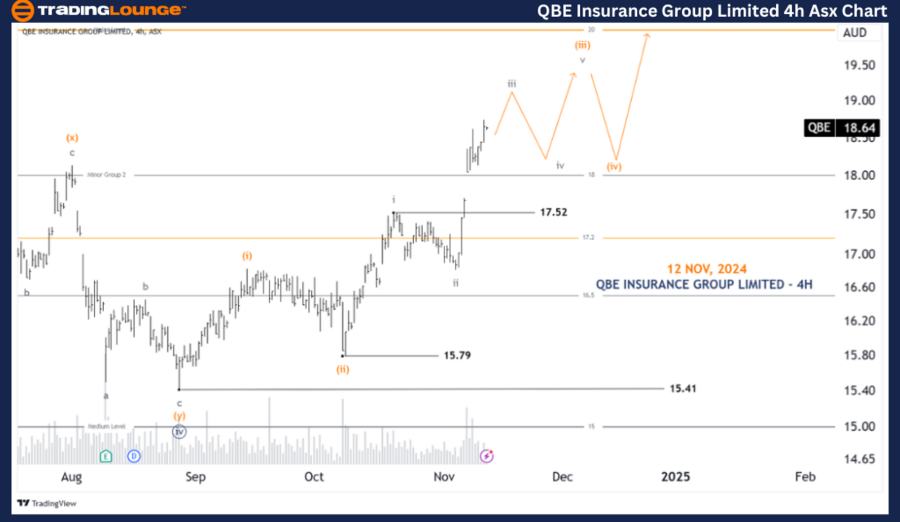
ASX: QBE INSURANCE GROUP LIMITED – QBE 4-Hour Chart Analysis

Function: Major trend (Minuette degree, orange)

Mode: Motive

Structure: Impulse

Position: Wave iii-gray of Wave (iii)-orange

Details:
From the low at 15.79, wave (iii)-orange is extending, with wave iii-gray currently unfolding. A higher push is expected in wave iii-gray, although a temporary pullback into wave iv-gray could occur before the final upward movement in wave v-gray completes the impulse. Importantly, wave iv-gray must not drop below 17.52 to maintain this wave count.

Invalidation Point: 17.52

Technical Analyst: Hua (Shane) Cuong, CEWA-M (Master’s Designation).

Source: visit Tradinglounge.com and learn From the Experts Join TradingLounge Here 

See Previous: TCL  Elliott Wave Technical Analysis 

VALUE Offer - Buy 1 Month & Get 3 Months!Click here

Access 7 Analysts Over 200 Markets Covered. Chat Room With Support

QBE-INSURANCE-GROUP-...


Conclusion:

This Elliott Wave analysis for ASX: QBE INSURANCE GROUP LIMITED highlights both the broader and short-term trends, offering actionable insights for traders and investors. Critical price levels, such as 17.52, serve as key validation and invalidation points for our wave structure, ensuring a robust analytical framework. By leveraging these insights, market participants can navigate QBE's price movements with greater precision and confidence.

Related

Achieve ASX Trading Success: In-Depth COMPUTERSHARE LIMITED (CPU) Stock Analysis and Elliott Wave Technical Forecast

Achieve ASX Trading Success: In-Depth COMPUTERSHARE LIMITED (CPU) Stock Analysis and Elliott Wave Technical Forecast

Our detailed Elliott Wave analysis for ASX: Computershare Limited (CPU) offers expert insights into ...

Read More >
Copper Commodity Elliott Wave Technical Analysis : Undergoing a Pullback Within a Larger Bullish Structure

Copper Commodity Elliott Wave Technical Analysis : Undergoing a Pullback Within a Larger Bullish Structure

Copper is undergoing a pullback within a larger bullish Elliott Wave structure that began in July 20...

Read More >
Current Market Trends and Potential Movements in Bitcoin’s Price to Enhance Strategy: BTCUSD Elliott Wave Technical Analysis

Current Market Trends and Potential Movements in Bitcoin’s Price to Enhance Strategy: BTCUSD Elliott Wave Technical Analysis

This analysis offers a detailed BTCUSD Elliott Wave forecast, providing Bitcoin price predictions, t...

Read More >
AMZN stock analysis: Comprehensive Amazon Inc.(AMZN) Elliott Wave Technical Analysis and Forecast

AMZN stock analysis: Comprehensive Amazon Inc.(AMZN) Elliott Wave Technical Analysis and Forecast

Gain valuable insights into Amazon's stock (AMZN) with in-depth analysis covering Elliott Wave p...

Read More >
Discover effective trading strategies for U.S.Dollar /Canadian Dollar (USD/CAD) Forex Elliott Wave Technical Analysis

Discover effective trading strategies for U.S.Dollar /Canadian Dollar (USD/CAD) Forex Elliott Wave Technical Analysis

Our comprehensive USD/CAD Elliott Wave analysis provides detailed insights into the US Dollar to Can...

Read More >
New Zealand Dollar / U.S. Dollar (NZDUSD) Elliott Wave Analysis: Trend, and Trading Insights, Technical Analysis, Price Prediction

New Zealand Dollar / U.S. Dollar (NZDUSD) Elliott Wave Analysis: Trend, and Trading Insights, Technical Analysis, Price Prediction

NZDUSD Elliott Wave analysis provides a detailed technical forecast of the New Zealand Dollar/U.S. D...

Read More >

Buy 1 Month

Get 3 Months!

Special Offer:

Trade Recommendations

Unleash the power of deversified trading with our comprehensive portfolio, covering:

  • Stock Trades
  • Crypto Trades
  • Forex Trades
  • Commodity Trades
Elliott Wave Analysis

Gain a competive edge with expert insights in to:

  • Global Indices
  • US Stocks & ASX Stocks
  • Forex & Crypto
  • Commodities
Top-Notch Trading Tools

Equip yourself with the tools of success:

  • Social Chat
  • Elliott Wave Algorithm
  • Screener
  • TradingLevels
  • Trading Game
7 Elliott Wave Analysts

Stay ahead of the market with daily charts and insightful videos
-Your secret to strategic trading!

JOIN HERE


Welcome to TradingLounge (ASIC A.R.No. 321187), specialists in trades, trading education and technical analysis, covering stocks, indices, commodities, forex and cryptocurrencies.

When you join TradingLounge you have access to everything we offer, including trade tools, educational content and a social platform to chat with like-minded investors.

Read more

@Copyright 2024 by tradinglounge.com

Contact Us

Australian no: 02 4787 6020

International no: +61 (2) 47876020

Pay with:

Find us on