TradingLounge Elliott Wave Analysis of BNBUSD: Daily Charts

In the financial world of cryptocurrency trading, understanding market trends and patterns is crucial for effective strategy formulation. The Elliott Wave Theory offers a framework for analyzing price movements, which can be particularly insightful when examining cryptocurrencies like the Binance/US Dollar (BNBUSD). This analysis provides a detailed look at the current technical setups according to Elliott Wave principles on both the Daily and H4 charts of BNBUSD.

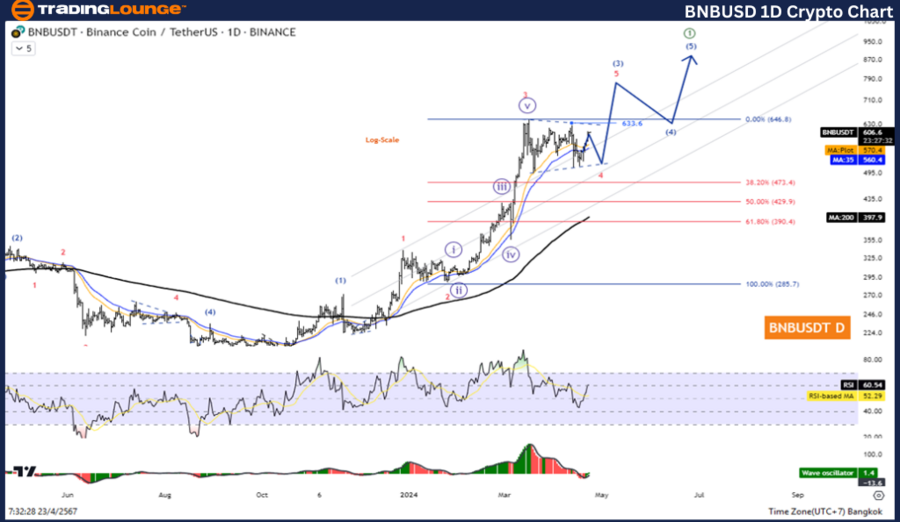
Binance/ U.S. dollar(BNBUSD) Daily Chart Analysis

BNBUSD Elliott Wave Technical Analysis

Function: Counter Trend

Mode: Corrective

Structure: Triangle

Position: Wave ((D))

Direction Next higher Degrees: wave 4

Wave Cancel invalid level: 508

Details: Correction in Triangle pattern before rising again in Wave 5.

Binance/ U.S. dollar(BNBUSD)Trading Strategy:

The short-term correction in Wave 4 with the Triangle pattern continues. Because there is still another decrease in wave E before an increase in wave 5, so wait for the correction to complete to look for opportunities to join the trend again.

Binance/ U.S. dollar(BNBUSD)Technical Indicators: The price is above the MA200 indicating an Uptrend, and The Wave Oscillator is a Bullish Momentum.

BNBUSD-1D-crypto-cha...


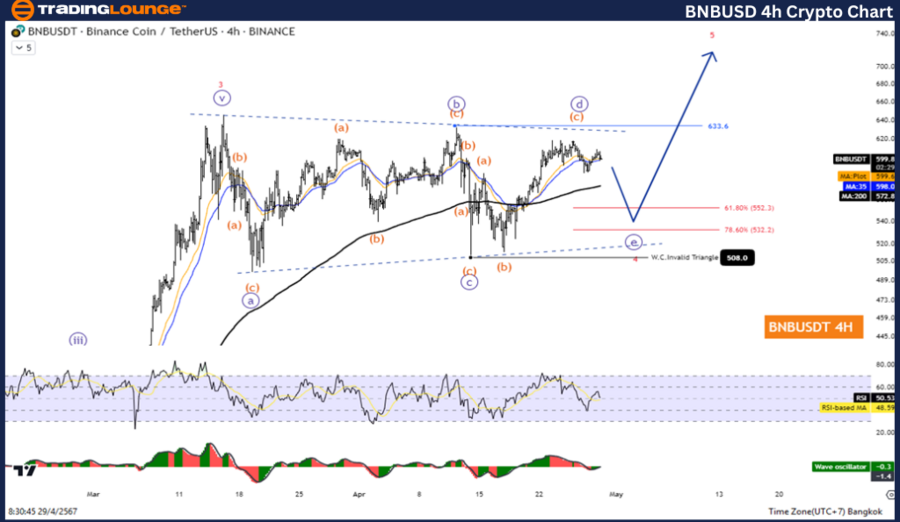
BNBUSD Elliott Wave Analysis TradingLounge H4 Chart,

Binance/ U.S. dollar(BNBUSD) H4 Chart Analysis

BNBUSD Elliott Wave Technical Analysis

Function: Counter Trend

Mode: Corrective

Structure: Triangle

Position: Wave ((D))

Direction Next higher Degrees: wave 4

Wave Cancel invalid level: 508

Details: Correction in Triangle pattern before rising again in Wave 5.

Binance/ U.S. dollar(BNBUSD)Trading Strategy:

The short-term correction in Wave 4 with the Triangle pattern continues. Because there is still another decrease in wave E before an increase in wave 5, so wait for the correction to complete to look for opportunities to join the trend again.

Binance/ U.S. dollar(BNBUSD)Technical Indicators: The price is above the MA200 indicating an uptrend. The Wave Oscillator is a Bullish Momentum.

Technical Analyst: Kittiampon Somboonsod

Source: visit Tradinglounge.com and learn From the Experts Join TradingLounge Here 

Previous: ChainLink/ U.S. dollar(LINKUSD) Pair Analysis

Special Trial Offer - 0.76 Cents a Day for 3 Months! Click here

Access 6 Analysts covering over 150 Markets. Chat Room With Support

BNBUSD-4Hr-crypto-ch...

Conclusion

In summary, the BNBUSD pair exhibits a typical Elliott Wave correction pattern with expected future bullish behaviour. By adhering to the principles laid out in this analysis, traders can enhance their decision-making process, ensuring alignment with broader market dynamics and capitalizing on potential opportunities presented by Elliott Wave forecasts.

Related

COAL INDIA Indian Stocks Elliott Wave Technical Analysis: Daily & Weekly Stock Forecast with Key Wave Signals

COAL INDIA Indian Stocks Elliott Wave Technical Analysis: Daily & Weekly Stock Forecast with Key Wave Signals

This article delivers a complete Elliott Wave analysis of COAL INDIA, detailing the stock's corr...

Read More >
XERO LIMITED's Stock Analysis & XRO Elliott Wave Technical Forecast, Price Movements In the ASX Market Outlook

XERO LIMITED's Stock Analysis & XRO Elliott Wave Technical Forecast, Price Movements In the ASX Market Outlook

Explore an in-depth Elliott Wave analysis for XERO LIMITED (ASX: XRO) with key insights into the cur...

Read More >
NEOUSD Elliott Wave Technical Analysis: Where we break down NEO's Price Movements, Trading Strategies, and Key Indicators

NEOUSD Elliott Wave Technical Analysis: Where we break down NEO's Price Movements, Trading Strategies, and Key Indicators

Explore the comprehensive NEOUSD Elliott Wave analysis, where we break down NEO's price movement...

Read More >
Maximize Gains with Expert NASDAQ Elliott Wave Analysis and Trading Strategies

Maximize Gains with Expert NASDAQ Elliott Wave Analysis and Trading Strategies

Explore our expert Elliott Wave Analysis and trading strategies for NASDAQ 100 (NDX) and leading tec...

Read More >
WTI Crudeoil Commodity Elliott Wave Technical analysis: Forecast future trends

WTI Crudeoil Commodity Elliott Wave Technical analysis: Forecast future trends

In this detailed analysis, we delve into the WTI Crude Oil market using Elliott Wave theory. We exam...

Read More >

$1 for 2 Weeks

then $29 a month!

What a Special Offer!

Trade Recommendations

Unleash the power of deversified trading with our comprehensive portfolio, covering 250+ markets:

  • Stock Trades
  • Crypto Trades
  • Forex Trades
  • Commodity Trades
Elliott Wave Analysis

Gain a competitive edge with expert insights and AI-powered Elliott Wave charting into:

  • Global Indices
  • US Stocks & ASX Stocks
  • Forex & Crypto
  • Commodities
Top-Notch Trading Tools

Equip yourself with the tools of success:

  • Real-time Chat rooms
  • Elliott Wave Algorithm
  • Portfolio tools
  • TradingLevels
  • Screener
  • Trading Game
7 Elliott Wave Analysts

Stay ahead of the market with daily charts and insightful videos
Your secret to strategic trading!

JOIN HERE


Welcome to TradingLounge (ASIC A.R.No. 321187), specialists in trades, trading education and technical analysis, covering stocks, indices, commodities, forex and cryptocurrencies.

When you join TradingLounge you have access to everything we offer, including trade tools, educational content and a social platform to chat with like-minded investors.

Read more

@Copyright 2024 by tradinglounge.com

Contact Us

Australian no: 02 4787 6020

International no: +61 (2) 47876020

Pay with:

Find us on