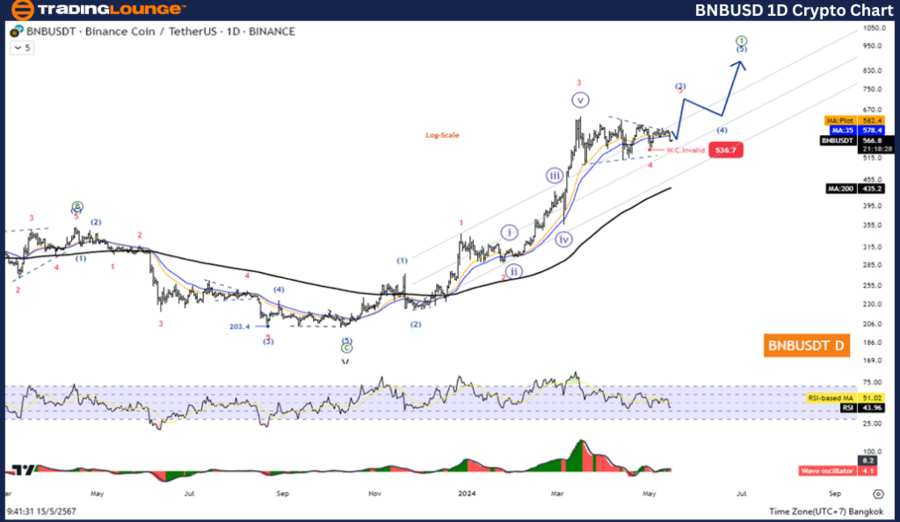
Elliott Wave Analysis of BNBUSD on Daily Charts
Binance/U.S. Dollar (BNBUSD) Elliott Wave Technical Analysis
Primary Function: Counter Trend
Current Mode: Corrective
Structural Pattern: Triangle
Current Position: Wave ((D))
Future Direction Indicators: Approaching wave 4
Invalidation Level for Current Wave: 508
Detailed Analysis:
According to the Elliott Wave principles, Binance/U.S. dollar (BNBUSD) is currently positioned in Wave ((D)) of a corrective triangle structure, which indicates a counter-trend momentum. The completion of Wave 4 is anticipated, which could potentially lead to an uptrend as the market enters Wave 5. This suggests that traders should watch for a price resurgence above the invalidation level at 508.
Trading Strategy for BNBUSD Based on Elliott Wave Forecast
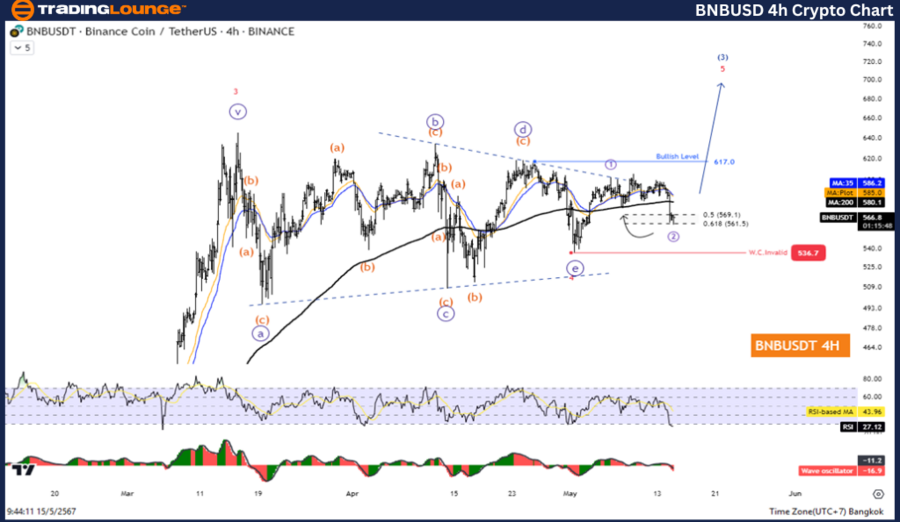
The Elliott Wave forecast for BNBUSD indicates a bullish scenario as it enters the fifth wave of the impulse sequence, traditionally known for its strong upward movements. This pattern typically divides into five smaller waves. So far, waves ((1)) and ((2)) have concluded, with the price now advancing in wave ((3)). This progression suggests a continuing upward trajectory potentially exceeding the 617 price level.
Key Trading Insights:
- Observation of Price Movements: Keep an eye on the emerging wave patterns, particularly the completion of wave ((3)) and the onset of wave ((4)).
- Price Target Considerations: Monitoring the 617 level as a potential region where the next significant price movement could occur.
Technical Indicators Supporting BNBUSD Elliott Wave Analysis
The technical landscape for Binance/U.S. dollar (BNBUSD) reinforces the bullish outlook depicted by the Elliott Wave analysis:
- MA200 Position: The price of BNBUSD is currently above the MA200, indicating a strong uptrend.
- Wave Oscillator Status: The Wave Oscillator shows bullish momentum, supporting the forecast of further price increases.

Elliott Wave Analysis of BNBUSD on H4 Charts
Overview of Market Position and Predictions:
Projection and Strategy: The analysis of the H4 charts aligns with the daily chart predictions, indicating that Wave 4 may soon conclude. This completion could propel the price into Wave 5, emphasizing a bullish outlook. Traders should consider this when planning their strategies, keeping in mind the critical level at 508, below which the current wave pattern would be invalidated.
Conclusion and Future Expectations for BNBUSD
The Elliott Wave analysis for Binance/U.S. dollar (BNBUSD) on both daily and H4 charts points towards a promising increase in price, guided by the principles of Elliott Wave theory. As the currency pair progresses through its wave cycle, particularly the pivotal fifth wave, both new and seasoned traders should monitor these levels closely. The indicators and wave patterns suggest a continuation of the bullish trend, offering potential opportunities for strategic entries in the market.
Technical Analyst: Kittiampon Somboonsod
Source: visit Tradinglounge.com and learn From the Experts Join TradingLounge Here
See Previous: Explore the potential for upcoming trends: Dogecoin Crypto
Special Trial Offer - 0.76 Cents a Day for 3 Months! Click here
Access 7 Analysts Over 170 Markets Covered. Chat Room With Support
