BA Elliott Wave Analysis – TradingLounge Daily Chart
The Boeing Company (BA) Daily Chart Analysis
BA Elliott Wave Technical Analysis
FUNCTION: Trend
MODE: Impulsive
STRUCTURE: Motive
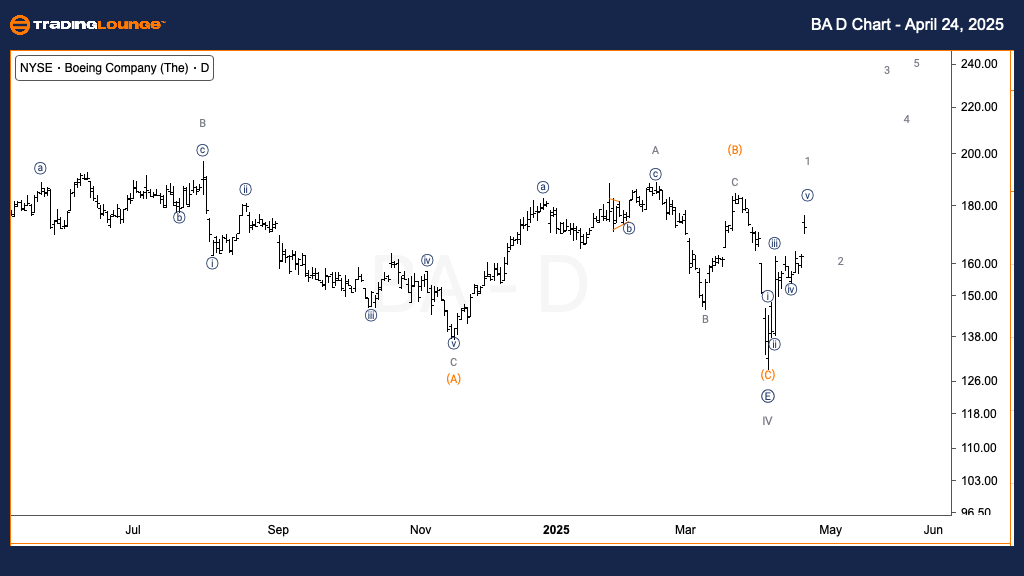
POSITION: Wave 1 of (1)
DIRECTION: Upside in wave 1
DETAILS:
Boeing (NYSE: BA) may have completed its long-term Cycle wave IV, indicating a possible major low is in place. The Elliott Wave structure now suggests the beginning of Primary wave (1), with wave 1 progressing to the upside. Resistance is anticipated near the TradingLevel2 zone around $200, which could act as the wave 1 top and trigger a corrective pullback before a broader bullish continuation. This setup supports a positive near-term outlook for BA stock.
The Boeing Company (BA) Elliott Wave Analysis – TradingLounge 1H Chart
The Boeing Company (BA) – 1-Hour Chart
BA Elliott Wave Technical Analysis
FUNCTION: Trend
MODE: Impulsive
STRUCTURE: Motive
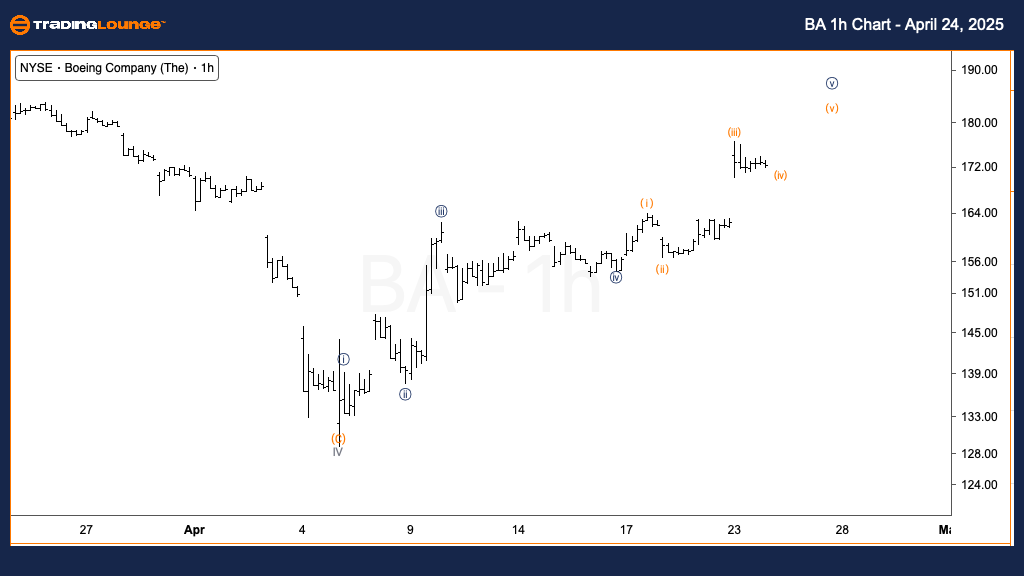
POSITION: Wave {v} of 1
DIRECTION: Upside in wave {v}
DETAILS:
In the short term, BA is in the final stages of completing wave {v} of Minor wave 1 on the 1-hour chart. The current bullish formation suggests another upward move is pending to finish wave (v). A breakout above recent highs would confirm the wave count and reinforce short-term bullish momentum, with key resistance levels approaching. Traders may monitor this potential final leg for opportunities before a wave 2 correction.
Technical Analyst: Alessio Barretta
Source: Visit Tradinglounge.com and learn from the Experts. Join TradingLounge Here
Previous: Palo Alto Networks Inc Elliott Wave Technical Analysis
VALUE Offer - Buy 1 Month & Get 3 Months!Click here
Access 7 Analysts Over 200 Markets Covered. Chat Room With Support