23Apr

Palo Alto Networks (PANW) Stock Forecast: Elliott Wave Signals Bullish Reversal With Price Targets & Key Support at $150

PANW Elliott Wave Forecast & Technical Analysis – TradingLounge

Elliott Wave analysis of Palo Alto Networks Inc. (NASDAQ: PANW) reviews both the daily and 1-hour charts to identify the current Elliott Wave count, analyse key support/resistance levels, and forecast potential future price moves using classic wave theory principles.

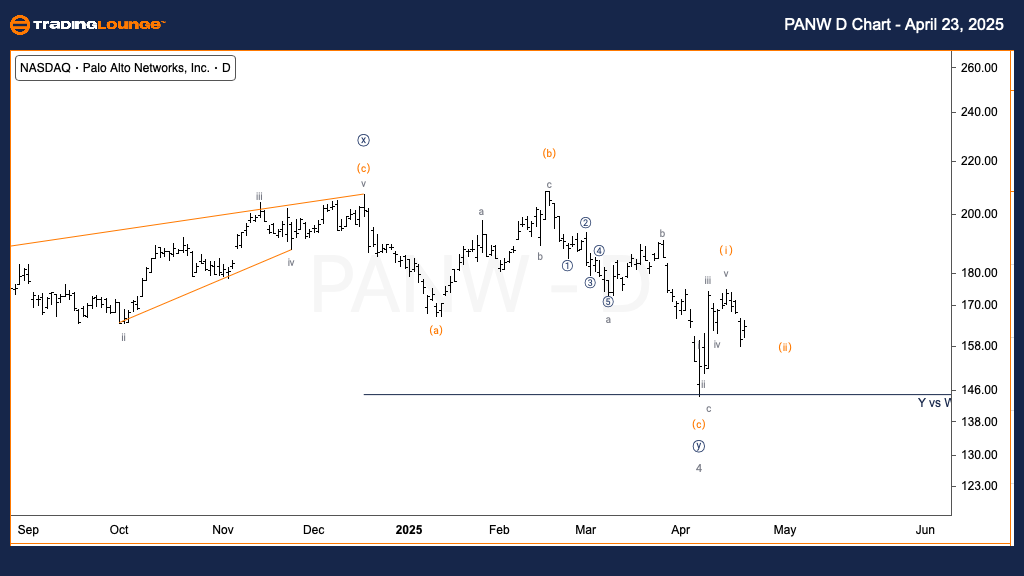
Palo Alto Networks Inc. (PANW) Elliott Wave Analysis – TradingLounge Daily Chart

PANW Elliott Wave Technical Analysis

Function: Trend

Mode: Motive

Structure: Impulsive

Position: Wave (i) of {i}

Direction: Upside in wave {iii}

Details: Minor wave 4 seems complete, confirmed by a bounce off the W vs. Y equality support. Price is holding above the Medium Level at $150, reinforcing the case for an emerging bullish wave {iii}.

Daily Chart Summary:

Palo Alto Networks (PANW) stock price analysis indicates renewed bullish momentum. With Minor wave 4 likely complete and $150 acting as solid support, wave (i) appears to be unfolding to the upside. Confirmation of this move strengthens the case for wave {iii} targeting higher levels in the next impulsive rally.

Palo-Alto-Networks-I...


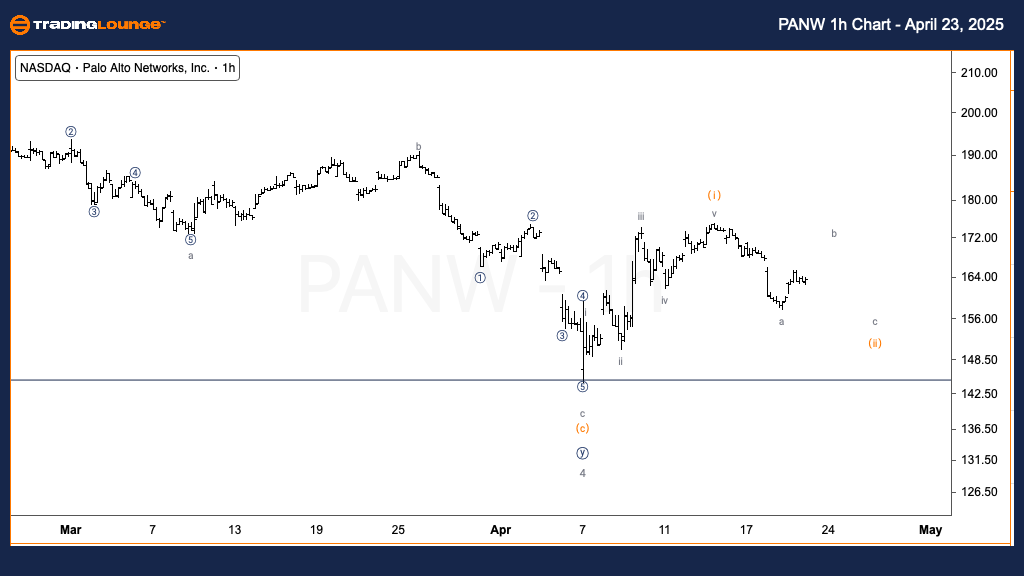
Palo Alto Networks Inc. Elliott Wave Analysis – TradingLounge 1-Hour Chart

PANW Elliott Wave Technical Analysis

Function: Trend

Mode: Motive

Structure: Impulsive

Position: Wave b of (ii)

Direction: Bottoming in wave (ii)

Details: PANW rallied in five waves from the April 7th low. The stock is currently in a possible wave (ii) pullback. Once the correction completes, a bullish continuation in wave (iii) is expected.

1-Hour Chart Summary:
Short-term PANW Elliott Wave outlook shows a potential bullish setup forming. After a clear five-wave advance, the ongoing corrective move could complete wave (ii). Traders should monitor for a completed three-wave structure, which could lead to the next bullish impulse via wave (iii).

Technical Analyst: Alessio Barretta

Source: Visit Tradinglounge.com and learn from the Experts. Join TradingLounge Here 

Previous: Fortinet Inc. (FTNT) Elliott Wave Technical Analysis

VALUE Offer - Buy 1 Month & Get 3 Months!Click here

Access 7 Analysts Over 200 Markets Covered. Chat Room With Support

Palo-Alto-Networks-I...

Related

British Pound/ Australian Dollar(GBPAUD) Elliott Wave Technical Analysis 19 January 24

British Pound/ Australian Dollar(GBPAUD) Elliott Wave Technical Analysis 19 January 24

British Pound and Australian Dollar Elliott Wave Technical Analysis dated 19 January 24, provides an...

Read More >
USDCHF Elliott Wave Technical Analysis: U.S. Dollar / Swiss Franc Forex Pair Analysis Indicates a Bullish Trend

USDCHF Elliott Wave Technical Analysis: U.S. Dollar / Swiss Franc Forex Pair Analysis Indicates a Bullish Trend

The USDCHF Elliott Wave analysis indicates a bullish trend, with active wave structures suggesting u...

Read More >
Discover How Newmont Corporation is Expected to Perform in the Upcoming Market Sessions: NEM Elliott Wave Analysis

Discover How Newmont Corporation is Expected to Perform in the Upcoming Market Sessions: NEM Elliott Wave Analysis

Our detailed Elliott Wave analysis of ASX Newmont Corporation (NEM) provides insights into the stock...

Read More >
Palo Alto Networks Stock Update: PANW Elliott Wave Analysis Shows Bullish Breakout Potential with Resistance and Extension

Palo Alto Networks Stock Update: PANW Elliott Wave Analysis Shows Bullish Breakout Potential with Resistance and Extension

Palo Alto Networks (PANW) Elliott Wave analysis shows bullish momentum in both daily and hourly char...

Read More >
Hang Seng Index Elliott Wave Technical Analysis: It covers the current trends and impulsive phases within the index's movement.

Hang Seng Index Elliott Wave Technical Analysis: It covers the current trends and impulsive phases within the index's movement.

This article provides a detailed Elliott Wave Analysis for the Hang Seng Index on both daily and wee...

Read More >
Berkshire Hathaway Inc.(BRK.B:NYSE) Elliott Wave Technical Analysis 22 November 23

Berkshire Hathaway Inc.(BRK.B:NYSE) Elliott Wave Technical Analysis 22 November 23

Stock Berkshire Hathaway Inc.(BRK.B: NYSE) Elliott Wave Technical Analysis 1-hour and 4-hour Chart d...

Read More >

$1 for 2 Weeks

then $29 a month!

What a Special Offer!

Trade Recommendations

Unleash the power of deversified trading with our comprehensive portfolio, covering 250+ markets:

  • Stock Trades
  • Crypto Trades
  • Forex Trades
  • Commodity Trades
Elliott Wave Analysis

Gain a competitive edge with expert insights and AI-powered Elliott Wave charting into:

  • Global Indices
  • US Stocks & ASX Stocks
  • Forex & Crypto
  • Commodities
Top-Notch Trading Tools

Equip yourself with the tools of success:

  • Real-time Chat rooms
  • Elliott Wave Algorithm
  • Portfolio tools
  • TradingLevels
  • Screener
  • Trading Game
7 Elliott Wave Analysts

Stay ahead of the market with daily charts and insightful videos
Your secret to strategic trading!

JOIN HERE


Welcome to TradingLounge (ASIC A.R.No. 321187), specialists in trades, trading education and technical analysis, covering stocks, indices, commodities, forex and cryptocurrencies.

When you join TradingLounge you have access to everything we offer, including trade tools, educational content and a social platform to chat with like-minded investors.

Read more

@Copyright 2024 by tradinglounge.com

Contact Us

Australian no: 02 4787 6020

International no: +61 (2) 47876020

Pay with:

Find us on