GX URA ETF Elliott Wave Analysis
Introduction to the GX Uranium ETF (URA) and Its Counter Trend Movements
The GX Uranium ETF (URA) stands as a pivotal financial instrument for investors aiming to delve into the uranium sector, encompassing mining, exploration, production, and nuclear energy operations. This comprehensive guide embarks on an Elliott Wave Analysis of the URA ETF, highlighting its current counter-trend movements, corrective mode, and unfolding flat structure. Positioned in the red wave (B) of the blue 4, the ETF's trajectory suggests a potential rise towards the $30 mark, predicated on an emerging flat pattern. However, a deeper dive into price action is essential for a clearer forecast.
GX Uranium ETF (URA) Elliott Wave Analysis
Function - Counter trend
Mode - Corrective
Structure - Emerging Flat
Position - Red wave (B) of blue 4
Direction - Red wave (B) of blue 4 is still in play
Details - Wave (B) is emerging higher and could hit $30. An expanding flat pattern is becoming more evident but more price action is needed to ascertain.
Understanding URA’s Market Dynamics
The Global X Uranium ETF (URA) is a beacon for those invested in the uranium industry's intricate facets. By offering exposure to leading companies within the uranium mining and nuclear energy sphere, URA serves as a strategic entry point for investors seeking to leverage the sector's dynamics without the complexities of direct company investments.
Recent Performance and Elliott Wave Analysis Insights
After a 17% downturn in February, the URA ETF is on a path to recovery, having recouped nearly half of its losses. Tracing back to March 2020, the ETF has carved a bullish path, notwithstanding a bearish stint from November 2021 to June 2022. With the trend tilting towards bullish realms, the anticipation builds for a rally post the current pullback, potentially eclipsing the highs of February 2024. Delving into the Elliott wave theory offers nuanced insights into the ETF's pricing and timing aspects.
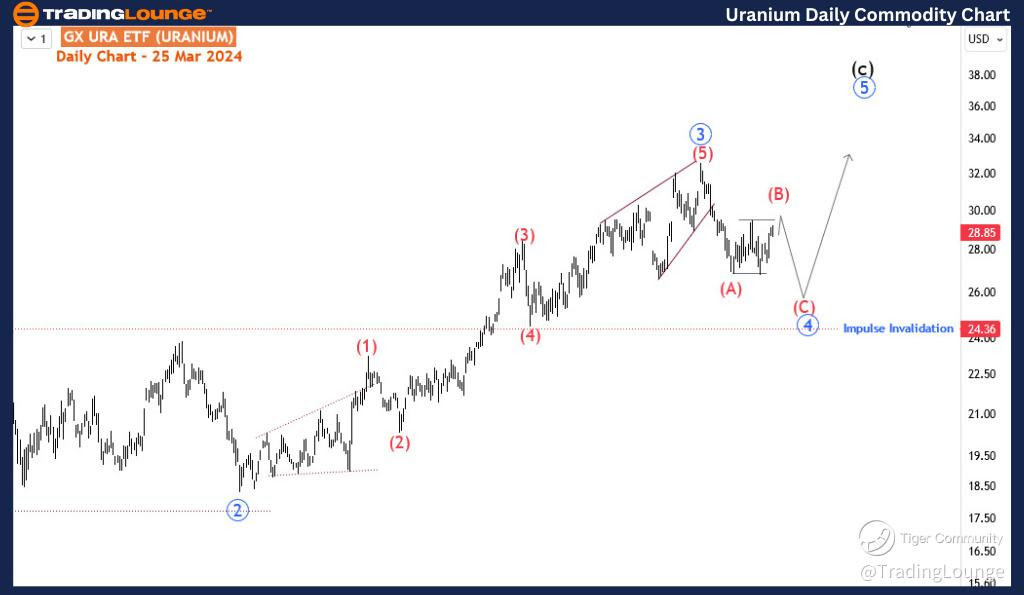
Long-Term Outlook and Potential Gains
A glimpse into the daily chart from a long-term lens reveals a potential impulse or a simple zigzag pattern unfolding since March 2020. This analysis forecasts a promising horizon for the URA, with a potential 175% gain, translating to an increase of $51 in the next one to two years from its present valuation. The journey from early July has seen the completion of the 3rd wave on 1 February 2024, marked by an ending diagonal pattern. The current uptick since 26 February likely represents wave (B) of the ongoing blue '4'.
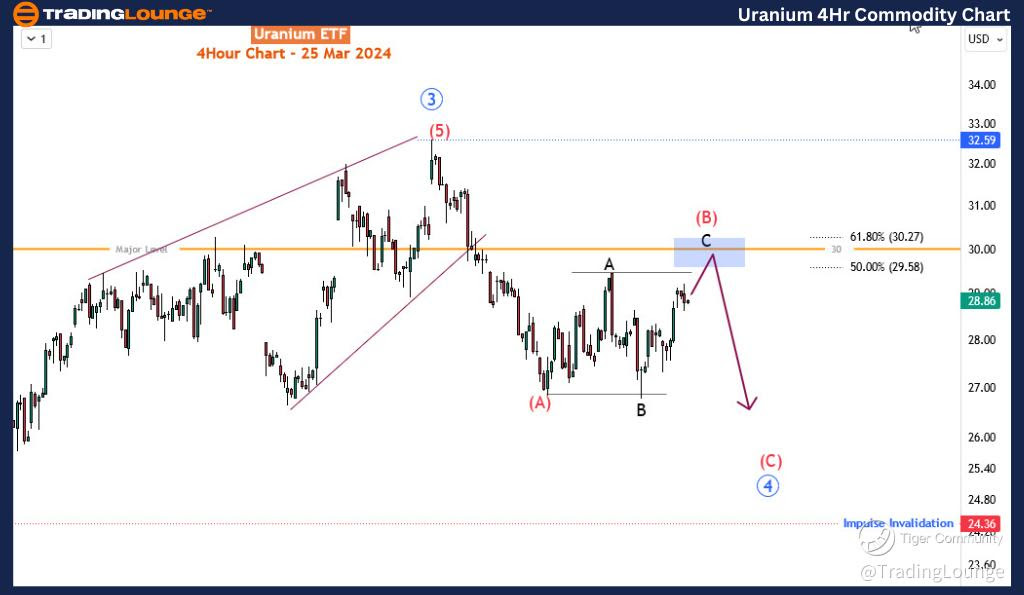
GX Uranium ETF (URA) Elliott Wave Analysis Trading Lounge 4-Hour Chart
Uranium 4-Hour Chart Analysis:
Short-Term Trading Perspectives and Future Prospects
Focusing on the 4-hour timeframe, wave (B) is morphing into an expanding flat pattern, aiming for the 29.58-30.27 resistance zone, closely aligning with the critical $30 level. This scenario presents short-term traders with potential shorting opportunities upon witnessing a bearish pivot at this juncture, heralding the commencement of wave (C) of blue '4'. The anticipation for the grander trade lies in the culmination of blue wave '4', setting the stage for the ensuing blue wave '5'. Nonetheless, the importance of maintaining the level at 24.36 remains paramount to preserve the impulse-momentum from July 2022.
Conclusion
The GX Uranium ETF (URA) encapsulates a dynamic investment avenue within the uranium sector, buoyed by its recent recovery and bullish outlook. Through the lens of Elliott Wave Analysis, the ETF's price movements and potential trajectories offer insightful perspectives for both long-term investors and short-term traders. As the URA navigates through its corrective phase towards anticipated heights, staying attuned to its evolving patterns remains crucial for capitalizing on emerging trading and investment opportunities.
Technical Analyst : Sanmi Adeagbo
Source: visit Tradinglounge.com and learn From the Experts Join TradingLounge Here
See Previous: WTI CrudeOil
TradingLounge Once Off SPECIAL DEAL: Here > 1 month Get 3 months.