NIFTY 50 (India) Elliott Wave Analysis Trading Lounge Day Chart
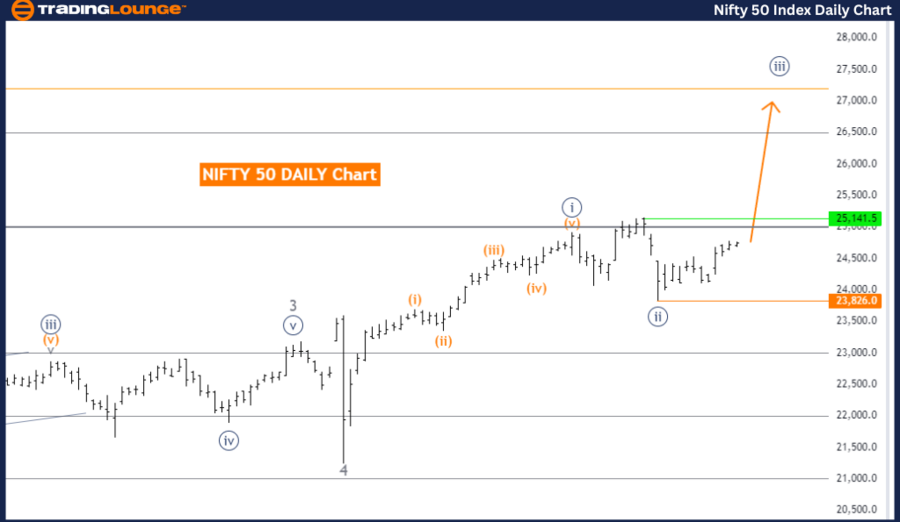
NIFTY 50 (India) Elliott Wave Analysis – Daily Chart
NIFTY 50 (India) Elliott Wave Technical Analysis
Function: Trend
Mode: Impulsive
Structure: Navy blue wave 3
Position: Gray wave 5
Direction Next Higher Degrees: Navy blue wave 3 (initiated)
Details: Completion of navy blue wave 2 of 5, with navy blue wave 3 currently unfolding.
Wave Cancel Invalid Level: 23,826.0
The NIFTY 50 index, analyzed on the daily chart using Elliott Wave theory, reveals an ongoing trend characterized by an impulsive movement. The primary structure identified is navy blue wave 3, indicating strong upward momentum.
Currently, the index is in gray wave 5, a component of the broader navy blue wave 3 structure. This suggests the index may be approaching the final stages of its current impulsive sequence, as wave 5 often signals the conclusion of an upward trend in Elliott Wave analysis.
Before entering this phase, the market completed navy blue wave 2 of 5, a corrective wave typically preceding a significant upward movement. With navy blue wave 2 concluded, the analysis points to the initiation of navy blue wave 3, which indicates continued bullish momentum.
The market's direction aligns with the next higher degree, confirming the progression of navy blue wave 3. This wave is expected to drive the index higher as it advances through the impulsive phase.
A critical level to watch is 23,826.0, designated as the wave cancel invalid level. If the index falls below this threshold, it would invalidate the current Elliott Wave count, signaling that the anticipated upward movement may not materialize as expected. This level is crucial for traders, as a breach could indicate a potential shift in the market's structure.
In summary, the NIFTY 50 index is currently in an impulsive trend phase, with navy blue wave 3 developing after the completion of navy blue wave 2 of 5. The bullish momentum is expected to persist, with 23,826.0 being a key level to monitor for potential changes in market direction.
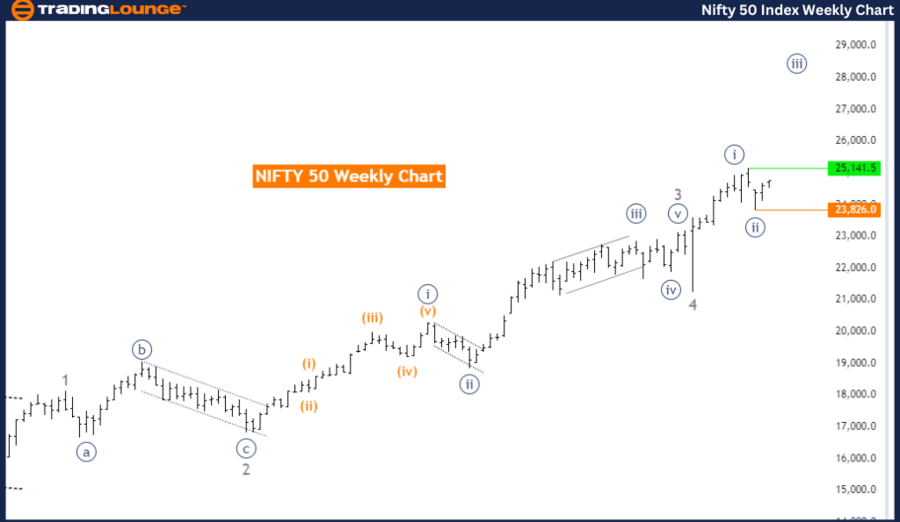
NIFTY 50 (India) Elliott Wave Analysis – Weekly Chart
NIFTY 50 (India) Elliott Wave Technical Analysis
Function: Trend
Mode: Impulsive
Structure: Navy blue wave 3
Position: Gray wave 5
Direction Next Higher Degrees: Navy blue wave 3 (initiated)
Details: Completion of navy blue wave 2 of 5, with navy blue wave 3 currently unfolding.
Wave Cancel Invalid Level: 23,826.0
On the weekly chart, the NIFTY 50 index is analyzed using Elliott Wave theory, showing a strong trend in an impulsive pattern. The primary structure identified is navy blue wave 3, indicating significant upward movement.
The index is currently positioned within gray wave 5, part of the larger navy blue wave 3 structure. This suggests that the index is nearing the final stages of its current upward trend, as wave 5 typically concludes the impulsive sequence in Elliott Wave theory.
Prior to this, the market completed navy blue wave 2 of 5, a corrective wave that generally precedes the next impulsive wave. With navy blue wave 2 complete, the market has entered navy blue wave 3, indicating a continuation of the bullish trend.
The next higher degree direction aligns with navy blue wave 3, reinforcing expectations of continued upward momentum. This wave is expected to drive the index further upward as it advances through the impulsive phase.
A crucial level to monitor in this analysis is 23,826.0, identified as the wave cancel invalid level. If the index falls below this threshold, the current Elliott Wave count would be invalidated, suggesting the expected upward movement might not occur. This level is vital for traders, as a breach could indicate a potential shift in the market’s structure.
In summary, the NIFTY 50 index is in a strong impulsive trend phase on the weekly chart, with navy blue wave 3 unfolding after the completion of navy blue wave 2 of 5. The bullish momentum is expected to continue, with 23,826.0 as a crucial level for any potential changes in market direction.
Technical Analyst: Malik Awais
Source: visit Tradinglounge.com and learn From the Experts Join TradingLounge Here
See previous: Hang Seng Index Elliott Wave Technical Analysis
Special Trial Offer - 0.76 Cents a Day for 3 Months! Click here
Access 7 Analysts Over 200 Markets Covered. Chat Room With Support