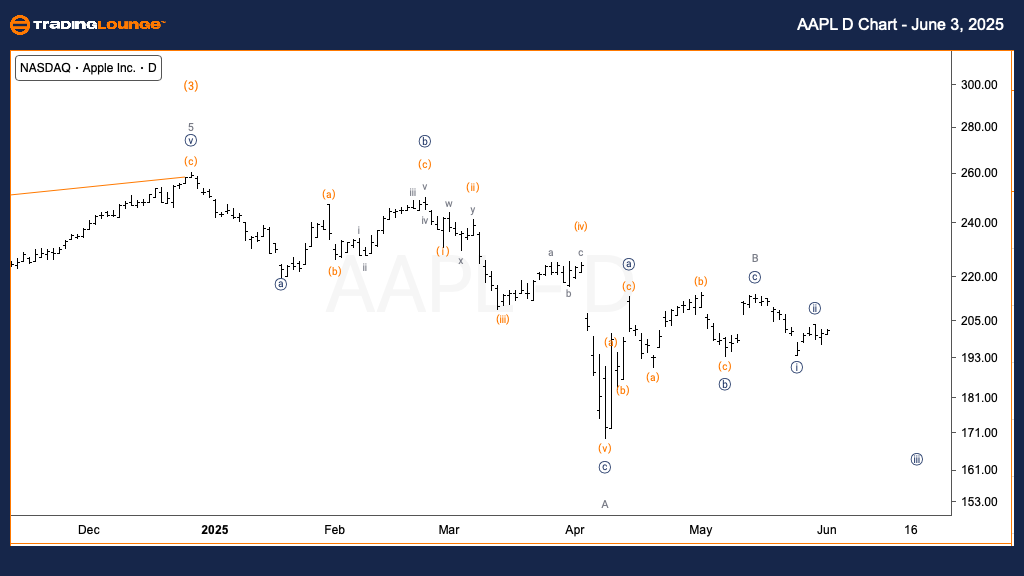
AAPL Elliott Wave Analysis – Trading Lounge Daily Chart Update
Apple Inc. (AAPL) Daily Chart Analysis
AAPL Elliott Wave Technical Outlook
FUNCTION: Counter Trend
MODE: Corrective
STRUCTURE: Flat
POSITION: Wave {ii} of C
DIRECTION: Downside projected in wave {iii}
DETAILS: Watching resistance at $200 to confirm the onset of Minor wave C targeting completion of Intermediate wave (4)
Apple Inc. (AAPL) is currently navigating a corrective Elliott Wave flat structure on the daily chart. The stock is progressing through Minor wave C, part of a broader Intermediate wave (4) correction. Price action near the $200 resistance level remains critical. Failure to break this ceiling may validate the downward scenario for wave {iii} of C, reinforcing the bearish outlook in this corrective phase.
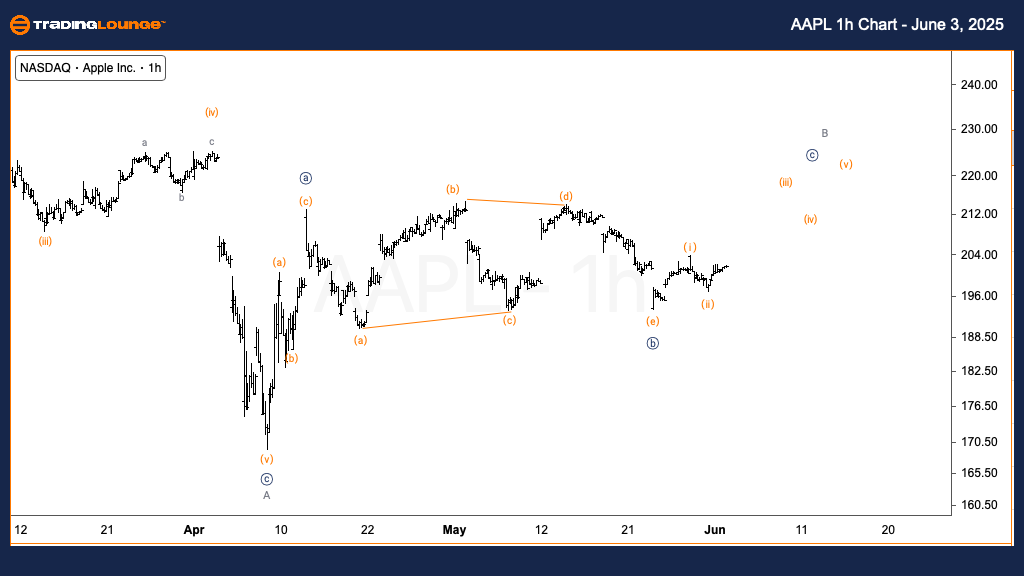
AAPL Elliott Wave Analysis – Trading Lounge 1-Hour Chart Update
Apple Inc. (AAPL) 1-Hour Chart
AAPL Elliott Wave Technical Forecast
FUNCTION: Counter Trend
MODE: Corrective
STRUCTURE: Flat
POSITION: Wave {c} of B
DIRECTION: Upside expected in wave {c}
DETAILS: A triangle in Minute wave {b} near $200 TradingLevel2 implies short-term consolidation before an upward breakout in wave B
On the 1-hour timeframe, Apple (AAPL) is showing signs of a short-term bullish move as it builds wave {c} of B. A triangle formation in Minute wave {b}, centered around the $200 TradingLevel2, indicates consolidation. This pattern suggests a potential breakout to the upside, completing wave B before any major downturn resumes in wave C.
Technical Analyst: Alessio Barretta
Source: Visit Tradinglounge.com and learn from the Experts. Join TradingLounge Here
Previous: Walmart Inc. (WMT) Elliott Wave Technical Analysis
VALUE Offer - Buy 1 Month & Get 3 Months!Click here
Access 7 Analysts Over 200 Markets Covered. Chat Room With Support