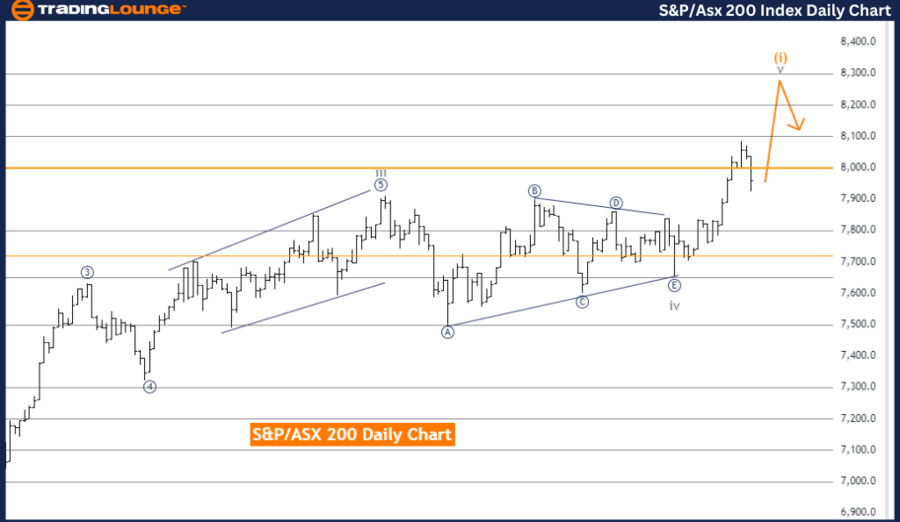
S&P/ASX 200 Elliott Wave Analysis Day Chart
S&P/ASX 200 Elliott Wave Technical Analysis
Trend Analysis
Function: Trend
Mode: Impulsive
Structure: Gray wave 5
Position: Orange wave 1
Next Lower Degrees Direction: Orange wave 2
Analysis Details The S&P/ASX 200 Elliott Wave Analysis on the daily chart offers a technical overview of the Australian stock market index using Elliott Wave Theory. This analysis aims to identify the current market trend, which is classified as impulsive. An impulsive trend indicates a strong directional move, typically consisting of five waves moving in the trend's primary direction.
Current Wave Structure The current wave structure is gray wave 5, the final wave in a sequence of five waves. This signifies the end of a larger impulsive move. Within this structure, the position is at orange wave 1, indicating the start of a new impulsive phase following the completion of gray wave 5.
Next Lower Degree Direction The next lower degree direction is orange wave 2. After the completion of orange wave 1, a corrective phase, orange wave 2, will follow, temporarily moving against the primary trend's direction.
Detailed Insights Details highlight that gray wave 4 appears to be completed, and now gray wave 5 of 1 is in play. This means the market has finished a corrective phase (gray wave 4) and has entered the final impulsive phase (gray wave 5) of the current sequence. The completion of gray wave 5 will mark the end of the larger impulsive move and the start of a new phase.
Summary
- The S&P/ASX 200 daily chart analysis identifies the market as being in an impulsive trend, currently in gray wave 5, with the position at orange wave 1.
- The next anticipated phase is orange wave 2, following the completion of orange wave 1.
- The analysis suggests that gray wave 4 is completed, and gray wave 5 of 1 is now in progress.
- This indicates the market is in the final stage of its current impulsive sequence before entering the next phase of movement.
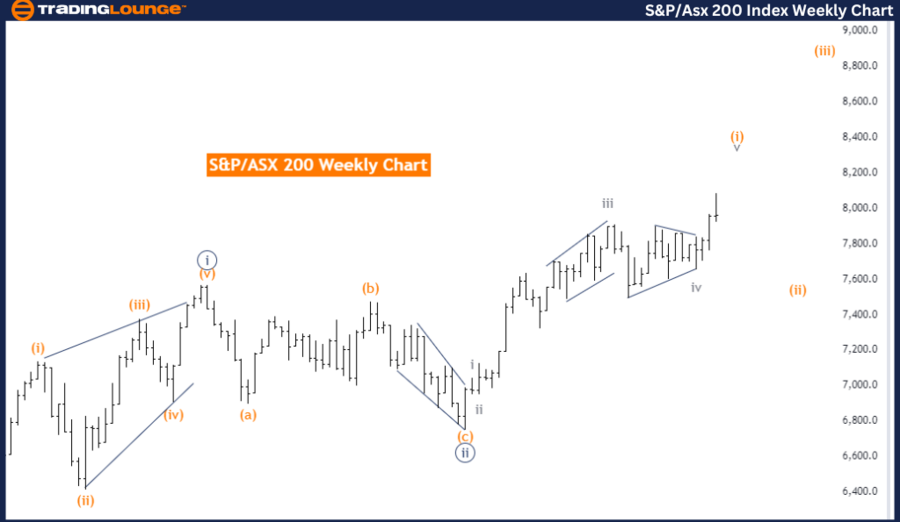
S&P/ASX 200 Elliott Wave Analysis Weekly Chart
S&P/ASX 200 Elliott Wave Technical Analysis
Trend Analysis
Function: Trend
Mode: Impulsive
Structure: Orange wave 1
Position: Navy blue wave 3
Next Lower Degrees Direction: Orange wave 2
Analysis Details The S&P/ASX 200 Elliott Wave Analysis on the weekly chart provides a technical view of the Australian stock market index using Elliott Wave Theory. This analysis shows the market in a trend function with an impulsive mode, indicating a strong directional movement generally consisting of five waves.
Current Wave Structure The current wave structure identified is orange wave 1, indicating the start of a new impulsive phase. The position within this structure is navy blue wave 3, the third wave in a larger impulsive movement. The third wave is typically the most robust and dynamic part of the Elliott Wave sequence.
Next Lower Degree Direction The next lower degree direction is orange wave 2, expected to follow the completion of orange wave 1. Orange wave 2 represents a corrective phase, usually moving against the primary trend direction before the larger impulsive movement resumes.
Detailed Insights Orange wave 1 of 3 is nearing its end. Once orange wave 1 of 3 completes, the market is expected to enter orange wave 2 of 3, a corrective phase providing a temporary retracement in the market's upward trend before the next impulsive wave, orange wave 3 of 3, begins.
Summary
- The S&P/ASX 200 is in an impulsive trend, currently in orange wave 1.
- The position is at navy blue wave 3, the third and often most dynamic wave in the sequence.
- The next phase is expected to be orange wave 2, following the near completion of orange wave 1 of 3.
- The analysis indicates the market is in the third wave of a larger impulsive sequence, with a corrective phase (orange wave 2 of 3) anticipated before the next impulsive movement resumes.
Technical Analyst: Malik Awais
Source: visit Tradinglounge.com and learn From the Experts Join TradingLounge Here
See previous: IBEX 35 Index Elliott Wave Technical Analysis
Special Trial Offer - 0.76 Cents a Day for 3 Months! Click here
Access 7 Analysts Over 170 Markets Covered. Chat Room With Support