Hang Seng Index Elliott Wave Analysis - Trading Lounge Day Chart
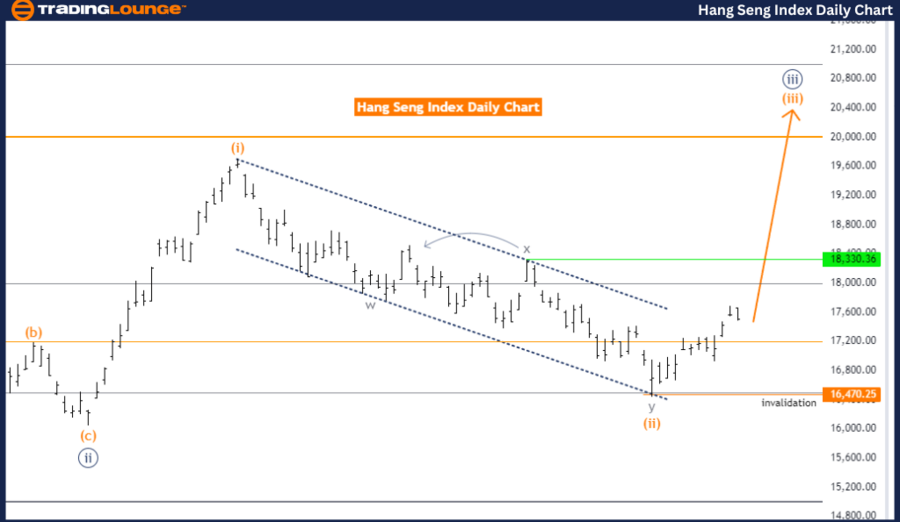
Hang Seng Index Daily Chart Analysis
Hang Seng Index Elliott Wave Technical Analysis
Function: Trend
Mode: Impulsive
Structure: Orange wave 3
Position: Navy Blue Wave 3
Direction Next Higher Degrees: Orange wave 3 (in progress)
Details:
The current analysis suggests that orange wave 2 has likely concluded, with orange wave 3 now unfolding.
Wave Cancel Invalid Level: 16470.25
The Hang Seng Index has been analyzed using Elliott Wave theory, revealing that the market is currently in an impulsive trend. The primary wave structure identified is orange wave 3, indicating a strong upward movement within the broader Elliott Wave framework. This wave is positioned within navy blue wave 3, reinforcing the ongoing bullish momentum.
Before orange wave 3 began, the market underwent orange wave 2, which typically represents a corrective phase or pullback within the overall uptrend. The completion of orange wave 2 suggests that the market has resumed its upward trajectory, leading to the development of orange wave 3.
As orange wave 3 continues to unfold, it is expected to drive the market higher. This wave is a significant part of the Elliott Wave structure, often associated with substantial price increases. Following the completion of orange wave 3, the market may enter another corrective phase, potentially leading to the formation of orange wave 4.
A critical element of this analysis is the wave cancel invalid level, set at 16470.25. This level is crucial because a decline below it would invalidate the current Elliott Wave count, indicating that the anticipated upward trend may not continue as expected, requiring a re-evaluation of the wave structure.
Summary:
The Hang Seng Index is currently experiencing a strong impulsive upward trend, with orange wave 3 in progress following the completion of orange wave 2. The market is likely to continue its upward movement, with the wave cancel invalid level at 16470.25 serving as a crucial point to monitor for any potential changes in the wave pattern.
Hang Seng Elliott Wave Analysis - Trading Lounge Weekly Chart
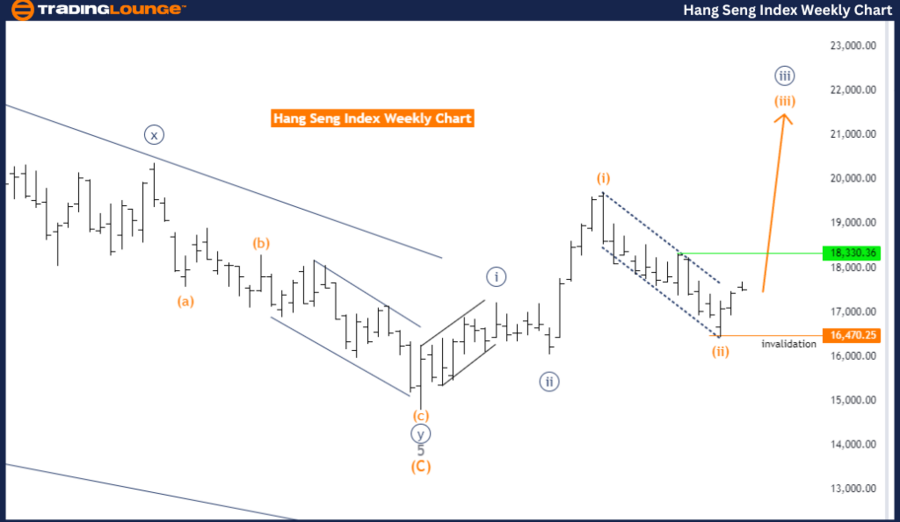
Hang Seng Index Weekly Chart Analysis
Function: Trend
Mode: Impulsive
Structure: Orange wave 3
Position: Navy blue wave 3
Direction Next Higher Degrees: Orange wave 3 (in progress)
Details:
The analysis indicates that orange wave 2 has likely concluded, and orange wave 3 is now in progress.
Wave Cancel Invalid Level: 16470.25
The Hang Seng Index is currently being evaluated using Elliott Wave theory, indicating that the market is in an impulsive trend phase. The primary wave structure identified is orange wave 3, a component of a broader upward trend. This wave is situated within navy blue wave 3, further highlighting the strength and continuation of bullish momentum.
Prior to this phase, the market completed orange wave 2, typically a corrective phase within the Elliott Wave cycle. The conclusion of this corrective wave suggests that the market has transitioned back to an upward trend, initiating the development of orange wave 3. This wave is expected to continue driving the market higher as it progresses.
The market's direction aligns with the next higher degree of trend, with orange wave 3 already in progress. This wave is a crucial component of the Elliott Wave structure, usually signaling a significant and strong price movement. The current analysis supports the expectation that the market will maintain its upward trajectory as orange wave 3 unfolds.
The wave cancel invalid level is set at 16470.25, serving as a critical threshold. If the market drops below this level, the current Elliott Wave count would be invalidated, suggesting that the anticipated bullish trend might not proceed as expected. This level is essential to monitor, as breaching it could indicate the need to reassess the wave structure.
Technical Analyst: Malik Awais
Source: visit Tradinglounge.com and learn From the Experts Join TradingLounge Here
See previous: Russell 2000 Elliott Wave Technical Analysis
Special Trial Offer - 0.76 Cents a Day for 3 Months! Click here
Access 7 Analysts Over 200 Markets Covered. Chat Room With Support
Conclusion:
The Hang Seng Index is in an impulsive trend phase, with orange wave 3 in progress following the completion of orange wave 2. The market is expected to continue its upward movement, with the wave cancel invalid level at 16470.25 being a key point to watch for any potential changes in the market's wave structure.