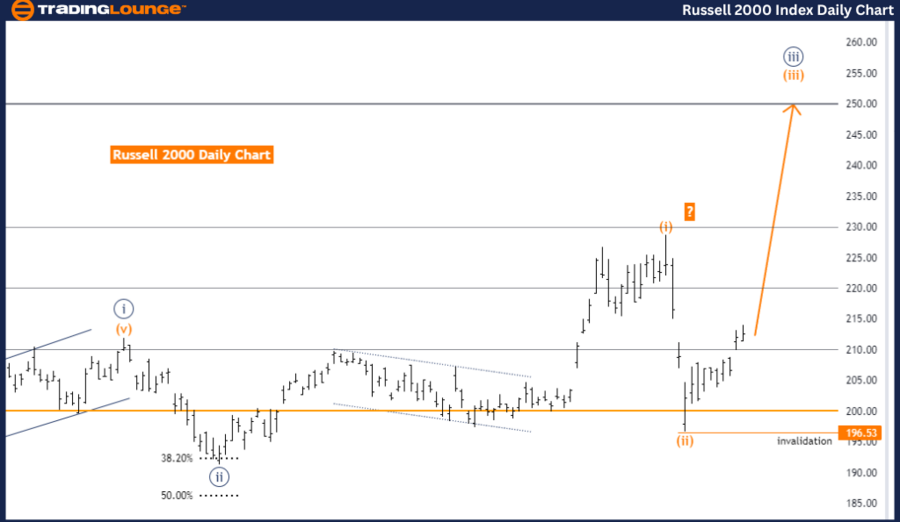
RUSSELL 2000 Elliott Wave Analysis Trading Lounge Day Chart
RUSSELL 2000 Day Chart Analysis
RUSSELL 2000 Elliott Wave Technical Analysis
FUNCTION: Trend
MODE: Impulsive
STRUCTURE: Orange wave 3
POSITION: Navy Blue Wave 3
DIRECTION NEXT HIGHER DEGREES: Orange wave 3 (started)
DETAILS: Orange wave 2 appears completed, with orange wave 3 currently unfolding.
Wave Cancel Invalid Level: 196.53
The Russell 2000 daily chart analysis, based on Elliott Wave theory, indicates that the market is in a trending phase with an impulsive wave structure. The primary focus is on orange wave 3, which is presently advancing, suggesting continued upward momentum. This wave is part of a larger structure, identified as navy blue wave 3, indicating a well-established upward trend likely in its mid to later stages.
Before this current phase, orange wave 2 appears to have completed its corrective pattern, initiating orange wave 3. In Elliott Wave terms, wave 3 typically represents the most dynamic and powerful wave, often linked with strong price advances. The completion of orange wave 2 and the start of orange wave 3 suggest that the market is now in a strong upward phase, with further gains expected as the wave progresses.
The analysis also emphasizes the next higher degree, where orange wave 3 is already underway, reinforcing the overall bullish outlook. As orange wave 3 continues to develop, the market is expected to rise, reflecting the impulsive nature of this wave.
However, it is essential to monitor the wave cancellation invalid level, set at 196.53. A breach of this level would invalidate the current Elliott Wave count, indicating that the wave structure may be incorrect or signaling a potential trend reversal.
In conclusion, the Russell 2000 daily chart is in an impulsive upward trend, with orange wave 3 currently progressing after the completion of orange wave 2. The market is expected to continue its upward movement as part of this wave, with the invalidation level at 196.53 being a crucial point to watch for any potential changes in the wave analysis.
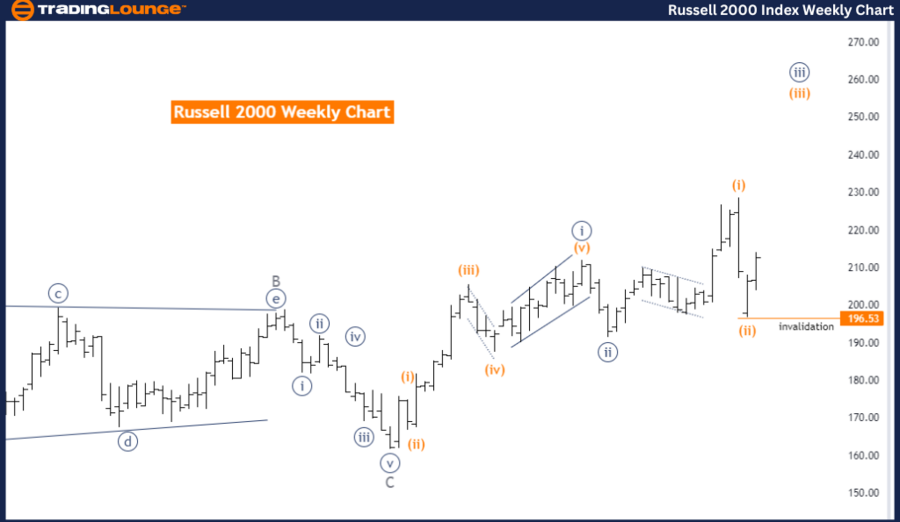
RUSSELL 2000 Elliott Wave Analysis Trading Lounge Weekly Chart
RUSSELL 2000 Elliott Wave Technical Analysis
RUSSELL 2000 Weekly Chart Analysis
FUNCTION: Trend
MODE: Impulsive
STRUCTURE: Orange wave 3
POSITION: Navy Blue Wave 3
DIRECTION NEXT HIGHER DEGREES: Orange wave 3 (started)
DETAILS: Orange wave 2 appears completed, with orange wave 3 currently in progress.
Wave Cancel Invalid Level: 196.53
The Russell 2000 weekly chart analysis, based on Elliott Wave theory, shows that the market is currently in a strong trending phase. The primary wave structure under consideration is orange wave 3, an impulsive wave, suggesting that the market is moving powerfully upward. This orange wave 3 is part of a larger structure, identified as navy blue wave 3, which further emphasizes the ongoing bullish momentum.
Before entering the current phase of orange wave 3, the analysis suggests that orange wave 2 completed its corrective pattern. In Elliott Wave theory, wave 2 typically represents a retracement or pullback from the initial wave 1 advance. The completion of this corrective wave implies that the market has resumed its upward trajectory with the onset of wave 3, which is generally characterized by strong price movements and significant market advances.
The analysis further indicates that orange wave 3 has already begun, placing the market in the midst of a strong impulsive move. This wave is expected to drive the market higher as it continues to unfold. The bullish outlook is reinforced by the direction of the next higher degrees, signaling that orange wave 3 is well underway, indicating continued upward momentum.
A crucial aspect of this analysis is the wave cancellation invalid level, set at 196.53. This level serves as a critical threshold; a breach would invalidate the current Elliott Wave count, potentially signaling a reversal or a need to reassess the wave structure.
In summary, the Russell 2000 weekly chart is in an impulsive upward trend, with orange wave 3 currently progressing after the completion of orange wave 2. The market is expected to continue its upward movement as part of this wave, with the invalidation level at 196.53 being a key point to monitor for any potential shifts in the wave analysis.
Technical Analyst: Malik Awais
Source: visit Tradinglounge.com and learn From the Experts Join TradingLounge Here
See previous: FTSE 100 Elliott Wave Technical Analysis
Special Trial Offer - 0.76 Cents a Day for 3 Months! Click here
Access 7 Analysts Over 170 Markets Covered. Chat Room With Support