TradingLounge Copper Commodity Elliott Wave Analysis

Copper prices have been in a notable downtrend since peaking in May 2024, marking a pivotal market reversal. Since May 21st, 2024, the metal has lost nearly 18% of its value. Despite a recent bounce, this movement appears to be a corrective phase within the broader context of a strong rally that started in October 2023. The ongoing correction seems to be forming a typical three-wave structure, a key aspect of Elliott Wave theory, suggesting that further downside movement is likely before the long-term uptrend resumes.

Copper Elliott Wave Technical Analysis

Long-Term Copper Chart Analysis

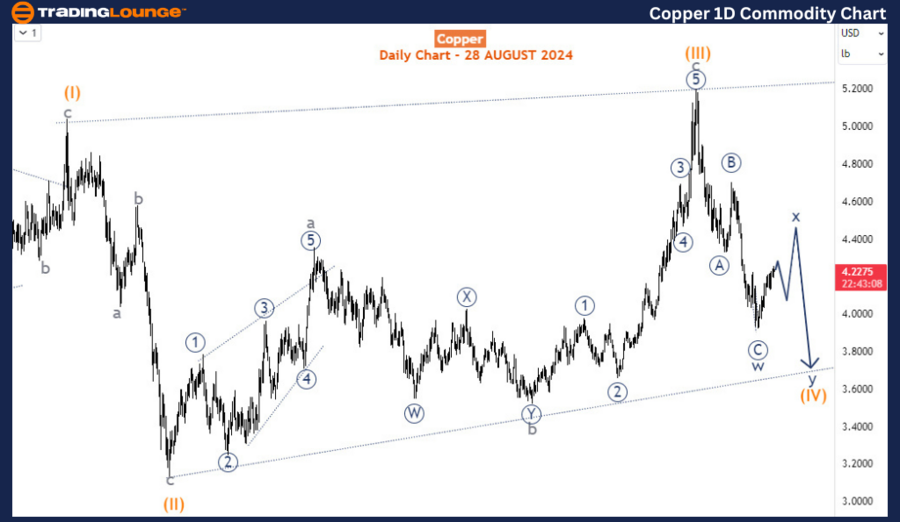
Examining Copper's long-term trend, particularly from March 2020 onwards, the metal seems to have developed a diagonal structure at the supercycle degree. In this analysis, Wave (I) ended in March 2022, followed by Wave (II) in July 2022, and the expansive Wave (III) concluded in May 2024. Currently, the market is unfolding Wave (IV), emerging from the May 2024 peak. This wave appears to be forming a double zigzag pattern, a common corrective structure in Elliott Wave analysis, which typically indicates a complex correction phase before the primary trend resumes.

Copper Daily Chart Insights

On the daily chart, evidence suggests that the cycle degree Wave w of (IV) was completed in early August 2024. This led to the ongoing corrective bounce, identified as cycle degree Wave x of (IV). According to Elliott Wave principles, cycle degree Wave x should ideally form a three-wave structure, and current market activity indicates we are likely in the first leg of this formation. The H4 chart supports this view by showing the price in an impulsive wave rally, specifically in the primary degree Wave A (circled) of cycle degree Wave x.

Copper-1D-Commodity-...


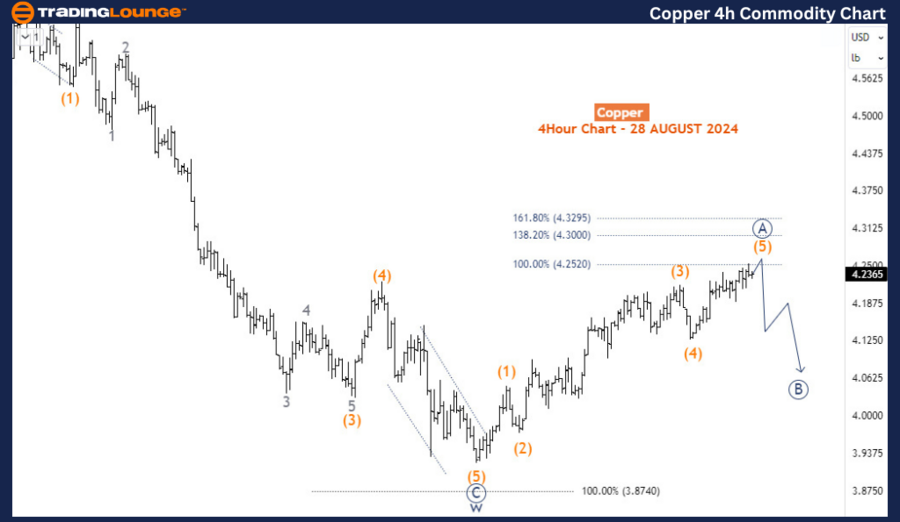
Copper 4-Hour Chart Analysis

The H4 chart offers a detailed view of this impulsive rally, revealing that the price is in Wave (5) of A (circled). This wave is now entering a crucial Fibonacci resistance zone, which often acts as a significant barrier for the market, potentially triggering a reversal. This zone is expected to serve as resistance, leading to the formation of Wave B (circled) in a decline. While short-term price action may see Copper initiating a bearish correction, the broader long-term outlook still points to a continuation of the downtrend before a sustained reversal is expected. This analysis aligns with the Elliott Wave principle, where corrections and rallies form part of a larger market cycle, eventually leading to the continuation of the primary trend.

Technical Analyst: Sanmi Adeagbo

Source: visit Tradinglounge.com and learn From the Experts Join TradingLounge Here 

See Previous: Natural Gas Elliott Wave Technical Analysis 

Special Trial Offer - 0.76 Cents a Day for 3 Months! Click here

Access 7 Analysts Over 200 Markets Covered. Chat Room With Support

Copper-4h-Commodity-...

Related

Binance/ U.S. dollar(BNBUSD) Elliott Wave Technical Analysis 7 December 23

Binance/ U.S. dollar(BNBUSD) Elliott Wave Technical Analysis 7 December 23

Binance/ U.S. dollar(BNBUSD) Elliott Wave Technical Analysis dated 7 December 23 Binance and US doll...

Read More >
Discover the in-depth Deere & Co.(DE) Stocks Elliott Wave Technical Analysis

Discover the in-depth Deere & Co.(DE) Stocks Elliott Wave Technical Analysis

Discover the in-depth Elliott Wave Analysis for Deere & Co. (DE), focusing on daily and 4-hour chart...

Read More >
Commodity Market Insights: Crypto Trends, Forex Movements, and Metals Analysis for Strategic Trading

Commodity Market Insights: Crypto Trends, Forex Movements, and Metals Analysis for Strategic Trading

Summary: Bitcoin, DOT, and XRP show upward trends in the crypto market, prompting consideration of l...

Read More >
TATA MOTORS Stocks Elliott Wave Technical Analysis - Stock Could be Approaching a Deeper Correction

TATA MOTORS Stocks Elliott Wave Technical Analysis - Stock Could be Approaching a Deeper Correction

This analysis of TATA Motors stock explores the current Elliott Wave counts and provides a detailed ...

Read More >
Walmart Stock Analysis: Bullish Wave Setup in WMT Chart Signals Breakout Opportunity Using Elliott Wave Forecast Techniques

Walmart Stock Analysis: Bullish Wave Setup in WMT Chart Signals Breakout Opportunity Using Elliott Wave Forecast Techniques

Walmart stock shows potential bullish continuation as Elliott Wave analysis suggests wave {iv} may b...

Read More >
Corn Commodity Elliott Wave Technical Analysis: Offering a Comprehensive Price Prediction for Corn Market

Corn Commodity Elliott Wave Technical Analysis: Offering a Comprehensive Price Prediction for Corn Market

This article provides an in-depth Elliott Wave analysis of the corn market, offering a comprehensive...

Read More >

$1 for 2 Weeks

then $29 a month!

What a Special Offer!

Trade Recommendations

Unleash the power of deversified trading with our comprehensive portfolio, covering 250+ markets:

  • Stock Trades
  • Crypto Trades
  • Forex Trades
  • Commodity Trades
Elliott Wave Analysis

Gain a competitive edge with expert insights and AI-powered Elliott Wave charting into:

  • Global Indices
  • US Stocks & ASX Stocks
  • Forex & Crypto
  • Commodities
Top-Notch Trading Tools

Equip yourself with the tools of success:

  • Real-time Chat rooms
  • Elliott Wave Algorithm
  • Portfolio tools
  • TradingLevels
  • Screener
  • Trading Game
7 Elliott Wave Analysts

Stay ahead of the market with daily charts and insightful videos
Your secret to strategic trading!

JOIN HERE


Welcome to TradingLounge (ASIC A.R.No. 321187), specialists in trades, trading education and technical analysis, covering stocks, indices, commodities, forex and cryptocurrencies.

When you join TradingLounge you have access to everything we offer, including trade tools, educational content and a social platform to chat with like-minded investors.

Read more

@Copyright 2024 by tradinglounge.com

Contact Us

Australian no: 02 4787 6020

International no: +61 (2) 47876020

Pay with:

Find us on