ASX: Commonwealth Bank of Australia (CBA) Elliott Wave Analysis (1D Chart)

Greetings, today we provide an updated Elliott Wave analysis for the Australian Stock Exchange (ASX) with a focus on the Commonwealth Bank of Australia (CBA). Our study suggests bullish potential, particularly within wave (iii) of ((iii)).

ASX: Commonwealth Bank of Australia (CBA) - Elliott Wave Technical Analysis

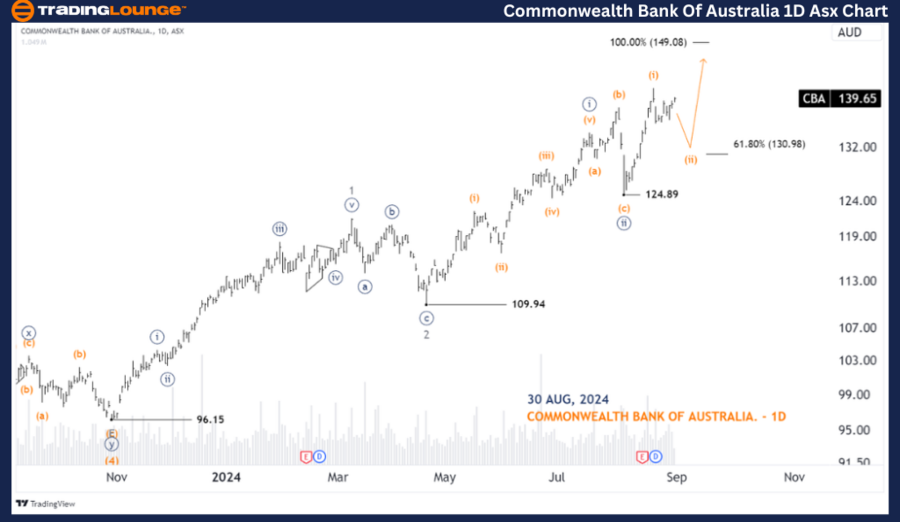
ASX: Commonwealth Bank of Australia (CBA) 1D Chart (Semilog Scale) Analysis

  • Function: Major Trend (Minor degree, gray)
  • Mode: Motive
  • Structure: Impulse
  • Position: Wave (ii)-orange of Wave ((iii))-navy

Details:
Wave (ii)-orange may not have completed its retracement, as the pullback appears too shallow. We anticipate a further push lower to finalize wave (ii)-orange. Following this, wave (iii)-orange is expected to resume its upward momentum. We are closely monitoring this for a potential long trade setup.

Invalidation Point: 124.89

Commonwealth-Bank-Of...


Commonwealth Bank of Australia (CBA) - Elliott Wave Analysis (4-Hour Chart)

ASX: Commonwealth Bank of Australia (CBA) - Elliott Wave Technical Analysis

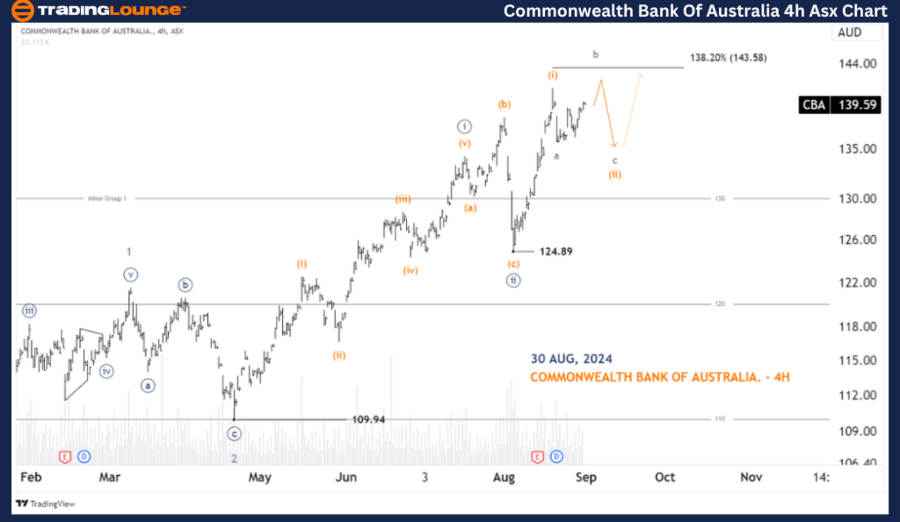
ASX: Commonwealth Bank of Australia (CBA) 4-Hour Chart Analysis

  • Function: Major Trend (Minuette degree, orange)
  • Mode: Motive
  • Structure: Impulse
  • Position: Wave c-grey of Wave (ii)-orange

Details:
Since reaching the low at 125.02, wave (i)-orange appears to have been completed, and wave (ii)-orange is currently unfolding. Given the shallow nature of this retracement, it is likely developing as a Flat, with wave b-grey pushing slightly higher before wave c-grey pulls back to complete wave (ii)-orange. We anticipate that wave (iii)-orange will then resume its upward trajectory. We continue to watch for a long trade setup.

Invalidation Point: 124.89

Technical Analyst:  Hua (Shane) Cuong, CEWA-M (Master’s Designation).

Source: visit Tradinglounge.com and learn From the Experts Join TradingLounge Here 

See Previous: ASX LIMITED Elliott Wave Technical Analysis

Special Trial Offer - 0.76 Cents a Day for 3 Months! Click here

Access 7 Analysts Over 200 Markets Covered. Chat Room With Support

Commonwealth-Bank-Of...


Conclusion

Our Elliott Wave analysis for ASX: Commonwealth Bank of Australia (CBA) provides insights into current market trends and potential trading opportunities. We have identified key price levels that serve as validation or invalidation signals for our wave count, which can enhance trading confidence. By considering these factors, we aim to offer a professional and objective perspective on market dynamics.

Related

AAVEUSD Elliott Wave Analysis: Technical Insights, Price Predictions, Bullish Trends, and Strategies for Smarter Crypto Trading

AAVEUSD Elliott Wave Analysis: Technical Insights, Price Predictions, Bullish Trends, and Strategies for Smarter Crypto Trading

This article provides an in-depth AAVEUSD Elliott Wave analysis, covering technical insights, price ...

Read More >
Euro/U.S. Dollar Forex Trading Strategies: Elliott Wave Technical Analysis for the EURUSD Currency Pair, Focusing Charts

Euro/U.S. Dollar Forex Trading Strategies: Elliott Wave Technical Analysis for the EURUSD Currency Pair, Focusing Charts

This article provides a comprehensive Elliott Wave analysis for the EURUSD currency pair, focusing o...

Read More >
Discover the best FTSE 100 stocks to buy: FTSE 100 (UK) Index Elliott Wave Technical Analysis and Trading

Discover the best FTSE 100 stocks to buy: FTSE 100 (UK) Index Elliott Wave Technical Analysis and Trading

Dive into our detailed FTSE 100 trading and UKX analysis to gain a comprehensive understanding of ma...

Read More >
Learn Effective S&P 500 Trading Strategies and Discover the Best Stocks to Buy: S&P 500 Index Elliott Wave Technical Analysis

Learn Effective S&P 500 Trading Strategies and Discover the Best Stocks to Buy: S&P 500 Index Elliott Wave Technical Analysis

Our in-depth S&P 500 Elliott Wave Analysis offers a detailed view of the current market trends, prov...

Read More >
FTSE 100 (UK)  Elliott Wave Analysis: Insights on Bullish Trends, Orange Wave 5, Navy Blue Wave 3, and Invalidation Levels

FTSE 100 (UK) Elliott Wave Analysis: Insights on Bullish Trends, Orange Wave 5, Navy Blue Wave 3, and Invalidation Levels

Elliott Wave Analysis of the FTSE 100 index, highlighting bullish trends in both daily and weekly ch...

Read More >

$1 for 2 Weeks

then $29 a month!

What a Special Offer!

Trade Recommendations

Unleash the power of deversified trading with our comprehensive portfolio, covering 250+ markets:

  • Stock Trades
  • Crypto Trades
  • Forex Trades
  • Commodity Trades
Elliott Wave Analysis

Gain a competitive edge with expert insights and AI-powered Elliott Wave charting into:

  • Global Indices
  • US Stocks & ASX Stocks
  • Forex & Crypto
  • Commodities
Top-Notch Trading Tools

Equip yourself with the tools of success:

  • Real-time Chat rooms
  • Elliott Wave Algorithm
  • Portfolio tools
  • TradingLevels
  • Screener
  • Trading Game
7 Elliott Wave Analysts

Stay ahead of the market with daily charts and insightful videos
Your secret to strategic trading!

JOIN HERE


Welcome to TradingLounge (ASIC A.R.No. 321187), specialists in trades, trading education and technical analysis, covering stocks, indices, commodities, forex and cryptocurrencies.

When you join TradingLounge you have access to everything we offer, including trade tools, educational content and a social platform to chat with like-minded investors.

Read more

@Copyright 2024 by tradinglounge.com

Contact Us

Australian no: 02 4787 6020

International no: +61 (2) 47876020

Pay with:

Find us on