13Mar

SPDR Select Sector Fund ETF – XLF Elliott Wave Analysis: Trading Strategy, Price Target, Fibonacci Levels for Accurate Trading Decisions.

SPDR Select Sector Fund ETF – XLF Elliott Wave Technical Analysis

XLF Daily Chart Analysis

Function: Major Trend

Mode: Motive

Structure: Impulse Wave

Position: Wave 4 (Grey)

Direction: Mini Decline

Details:

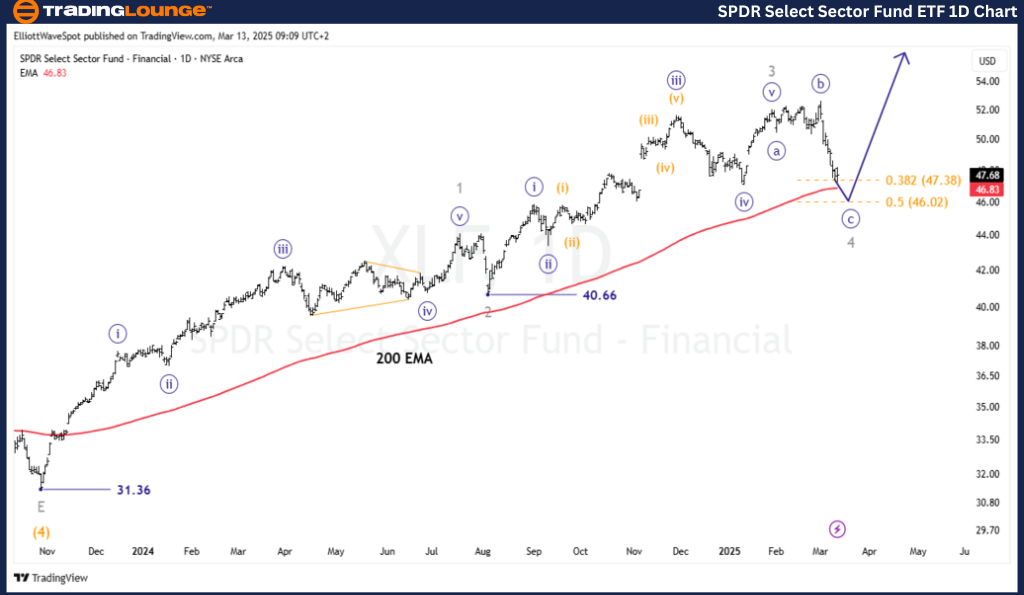
  • The bearish trend remains dominant, moving towards the final stage of wave [c] within a flat wave 4.
  • Wave 4 is projected to find support between $46.02 and $47.38, aligning with the 38.2% and 50% Fibonacci retracement levels and the 200 EMA, a key support zone.
  • A bullish reversal confirmation will occur if the price breaks above $48.00.
  • Following the wave 4 bottom, a 5th wave rally is expected, likely pushing prices above the wave 4 origin.

🔴 Invalidation Level: A drop below $44.00 would question the current Elliott Wave structure.

SPDR-Select-Sector-1...


SPDR Select Sector Fund ETF – XLF Elliott Wave Technical Analysis

XLF 4-Hour Chart Analysis

Function: Minor Trend (Grey)

Mode: Corrective

Structure: Impulse

Position: Wave [c] (Navy) of Wave 4 (Grey)

Direction: Downtrend

Details:

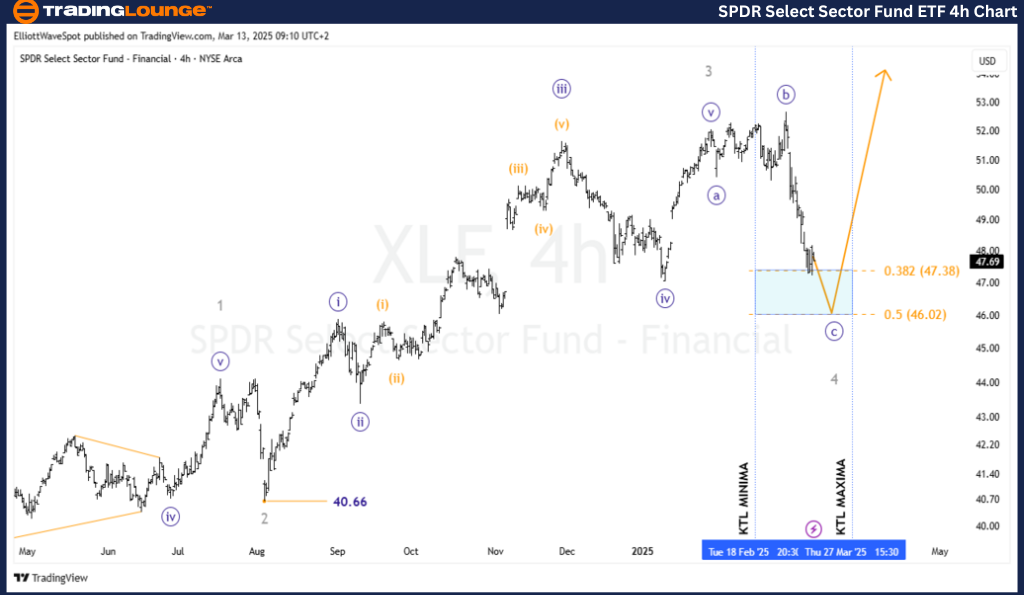
  • A bullish rally is expected after the wave [iv] retracement is completed.
  • Wave iv is projected to conclude within the highlighted Fibonacci retracement levels.
  • The Kennedy Blue Box, a common reversal zone for 4th waves, suggests an upcoming reversal.
  • If the price declines to 50%, traders could enter long positions at the 38.2% retracement, setting stop-losses below the 61.8% level.
  • The minimum target is $52.50.

🔴 Invalidation Level: A drop below $44.00 would challenge the current Elliott Wave count.

Technical Analyst: Siinom

Source: Visit Tradinglounge.com and learn from the Experts. Join TradingLounge Here 

See Previous: JPMorgan Equity Premium Income ETF – JEPI Elliott Wave Technical Analysis

VALUE Offer - Buy 1 Month & Get 3 Months!Click here

Access 7 Analysts Over 200 Markets Covered. Chat Room With Support

SPDR-Select-Sector-4...


Conclusion

The XLF wave decline continues, approaching the end of its corrective phase.
Once the correction is complete, a strong bullish rally should follow, targeting levels above the origin of wave 4.
This scenario offers a key buying opportunity for ETF traders looking for long setups.
Following Elliott Wave principles and respecting invalidation levels is critical to mitigating risk.

Related

Elliott Wave Analysis & Stocks Trading Strategies | Trading Lounge

Elliott Wave Analysis & Stocks Trading Strategies | Trading Lounge

Risk on for US Tech stocks and Indices. SP500 supported on 6000 and the Nasdaq supported on 20,000 w...

Read More >
U.S.Dollar/Swiss Franc(USDCHF) Elliott Wave Analysis: Daily Chart Review - February 2, 2024

U.S.Dollar/Swiss Franc(USDCHF) Elliott Wave Analysis: Daily Chart Review - February 2, 2024

Unlock profitable trading opportunities with expert insights from the latest USDCHF Elliott Wave Ana...

Read More >
Dogecoin Price News Today: DOGEUSD Elliott Wave Technical Analysis and Crypto Dogecoin and U.S. Dollar Pair

Dogecoin Price News Today: DOGEUSD Elliott Wave Technical Analysis and Crypto Dogecoin and U.S. Dollar Pair

This detailed analysis of Dogecoin (DOGE) focuses on Elliott Wave patterns, price trends, and tradin...

Read More >
S&P 500 Elliott Wave Technical Analysis: Forecasts, Trading Strategies, and Market Trends for Successful Stock Trading

S&P 500 Elliott Wave Technical Analysis: Forecasts, Trading Strategies, and Market Trends for Successful Stock Trading

S&P 500 Elliott Wave Analysis including day and weekly charts. Understand wave patterns like impulse...

Read More >
The Elliott Wave Analysis for Texas Instruments Inc. (TXN) Reveals a Bullish Trend, Supported by Both the Daily and 1-hour Charts

The Elliott Wave Analysis for Texas Instruments Inc. (TXN) Reveals a Bullish Trend, Supported by Both the Daily and 1-hour Charts

Our Elliott Wave analysis for Texas Instruments Inc. (TXN) highlights a bullish trend, with both dai...

Read More >
Learn about BXB Stock Trends, and What to Expect in Upcoming Sessions: Brambles Limited Elliott Wave Technical Forecast

Learn about BXB Stock Trends, and What to Expect in Upcoming Sessions: Brambles Limited Elliott Wave Technical Forecast

Our detailed Elliott Wave analysis on Brambles Limited (BXB) provides traders with key insights into...

Read More >

$1 for 2 Weeks

then $29 a month!

What a Special Offer!

Trade Recommendations

Unleash the power of deversified trading with our comprehensive portfolio, covering 250+ markets:

  • Stock Trades
  • Crypto Trades
  • Forex Trades
  • Commodity Trades
Elliott Wave Analysis

Gain a competitive edge with expert insights and AI-powered Elliott Wave charting into:

  • Global Indices
  • US Stocks & ASX Stocks
  • Forex & Crypto
  • Commodities
Top-Notch Trading Tools

Equip yourself with the tools of success:

  • Real-time Chat rooms
  • Elliott Wave Algorithm
  • Portfolio tools
  • TradingLevels
  • Screener
  • Trading Game
7 Elliott Wave Analysts

Stay ahead of the market with daily charts and insightful videos
Your secret to strategic trading!

JOIN HERE


Welcome to TradingLounge (ASIC A.R.No. 321187), specialists in trades, trading education and technical analysis, covering stocks, indices, commodities, forex and cryptocurrencies.

When you join TradingLounge you have access to everything we offer, including trade tools, educational content and a social platform to chat with like-minded investors.

Read more

@Copyright 2024 by tradinglounge.com

Contact Us

Australian no: 02 4787 6020

International no: +61 (2) 47876020

Pay with:

Find us on