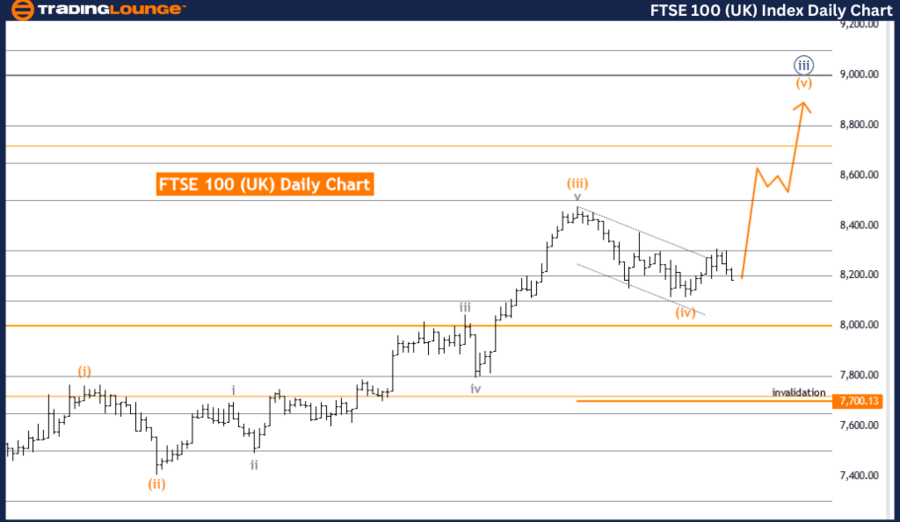
FTSE 100 (UK) Elliott Wave Analysis Trading Lounge Day Chart
FTSE 100 (UK) Elliott Wave Technical Analysis
FUNCTION: Trend
MODE: Impulsive
STRUCTURE: Orange Wave 5
POSITION: Navy Blue Wave 3
DIRECTION NEXT LOWER DEGREES: Navy Blue Wave 4
DETAILS: Orange wave 4 appears complete. Now, orange wave 5 of navy blue wave 3 is in progress. Wave Cancel invalid level: 7700.13
The FTSE 100 Elliott Wave analysis on the daily chart offers an insightful view of current market conditions using Elliott Wave Theory. Here’s a detailed breakdown:
Trend Identification: The market is trending, following a specific direction without exhibiting sideways or erratic movements.
Impulsive Mode: The current wave is in line with the overall trend, showing strong market movement and continuation of the prevailing trend.
Wave Structure: We are in orange wave 5, the final wave in the impulsive sequence of the Elliott Wave cycle, suggesting the last leg of the upward movement before a potential larger correction.
Current Position: Positioned in navy blue wave 3, indicating an upward phase within the larger impulsive trend.
Next Lower Degrees Direction: After orange wave 5 completes, navy blue wave 4 is expected, marking a corrective phase, typically a pullback or retracement, before potentially resuming the upward trend.
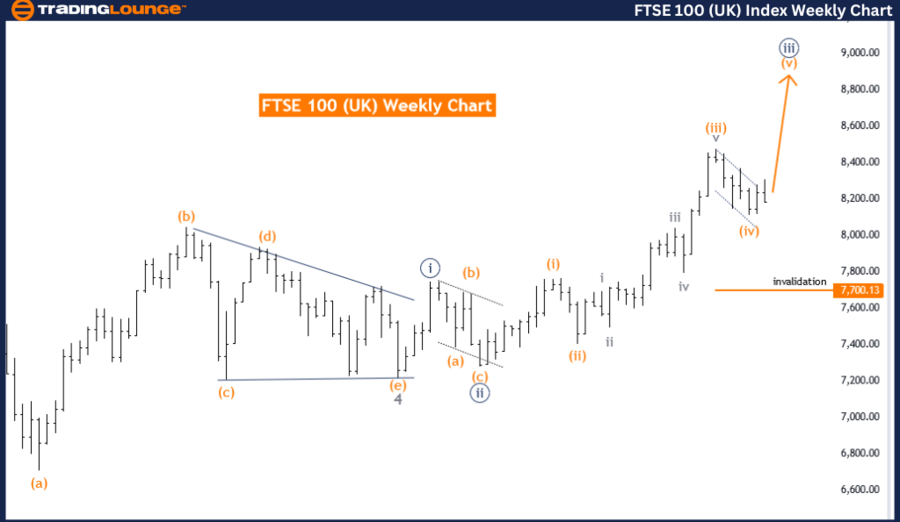
FTSE 100 (UK) Elliott Wave Analysis Trading Lounge Weekly Chart
FTSE 100 (UK) Technical Analysis
FUNCTION: Trend
MODE: Impulsive
STRUCTURE: Orange Wave 5
POSITION: Navy Blue Wave 3
DIRECTION NEXT LOWER DEGREES: Navy Blue Wave 4
DETAILS: Orange wave 4 appears complete. Now, orange wave 5 of navy blue wave 3 is in progress. Wave Cancel invalid level: 7700.13
The FTSE 100 Elliott Wave analysis on the weekly chart provides a comprehensive overview of current market conditions using Elliott Wave Theory. Here’s a detailed breakdown:
Trend Identification: The market is trending, moving in a specific direction rather than sideways or erratic movements.
Impulsive Mode: The current wave aligns with the overall trend, indicating strong market movement and continuation of the prevailing trend.
Wave Structure: We are in orange wave 5, the final wave in the impulsive sequence of the Elliott Wave cycle, suggesting the last leg of the upward movement before a potential larger correction.
Current Position: Positioned in navy blue wave 3, indicating an upward phase within the larger impulsive trend.
Next Lower Degrees Direction: After orange wave 5 completes, navy blue wave 4 is expected, marking a corrective phase, typically a pullback or retracement, before potentially resuming the upward trend.
Key Details:
- Completion of Orange Wave 4: Orange Wave 4 appears complete, indicating the market is now in orange wave 5 of navy Blue Wave 3, a critical phase for traders looking to capitalize on the impulsive trend.
- Wave Cancellation Invalid Level: Set at 7700.13. Falling below this point invalidates the current wave count, necessitating a reevaluation of the wave structure.
Summary: The FTSE 100 weekly chart analysis identifies:
- An impulsive trend within orange wave 5.
- Positioning in navy blue wave 3.
- Upcoming corrective phase as navy blue wave 4 after orange wave 5 completes.
- Orange wave 4 completion and progression into orange wave 5 of navy blue wave 3.
- A significant wave cancel invalid level at 7700.13.
Technical Analyst: Malik Awais
Source: visit Tradinglounge.com and learn From the Experts Join TradingLounge Here
See previous: IBEX 35 (Spain) Elliott Wave Technical Analysis
Special Trial Offer - 0.76 Cents a Day for 3 Months! Click here
Access 7 Analysts Over 170 Markets Covered. Chat Room With Support