27May

Unlocking ASX Trading Success: NEWMONT CORPORATION - NEM Stock Analysis & Elliott Wave Technical Forecast

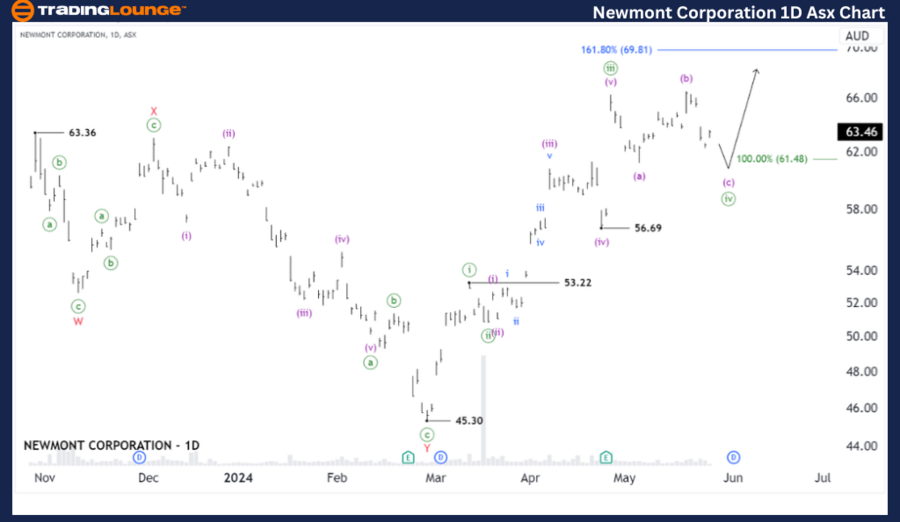
ASX: NEWMONT CORPORATION - NEM  Elliott Elliott Wave Technical Analysis TradingLounge (1D Chart)

Greetings, Our Elliott Wave analysis today updates the Australian Stock Exchange (ASX) with NEWMONT CORPORATION - NEM. We see that wave ((iv))-green appears to be nearing completion, and following that wave ((v))-green could return to push higher.

ASX: NEWMONT CORPORATION - NEM  Elliott Wave Technical Analysis  

ASX: NEWMONT CORPORATION - NEM  1D Chart (Semilog Scale) Analysis

Function: Major trend (Minute degree, green)
Mode: Motive
Structure: Impulse
Position: Wave (c)-purple of Wave ((iv))-green  
Details: The short-term outlook indicates that wave (iv)-purple has ended sooner than expected, and wave (v)-purple is unfolding to push higher. Now, waves i and ii-blue have just completed, and wave iii-blue is unfolding to push higher, targeting 69.81. It is essential for the price to remain above 63.66 to maintain this outlook.
Invalidation point: 53.22

Newmont-Corporation-...


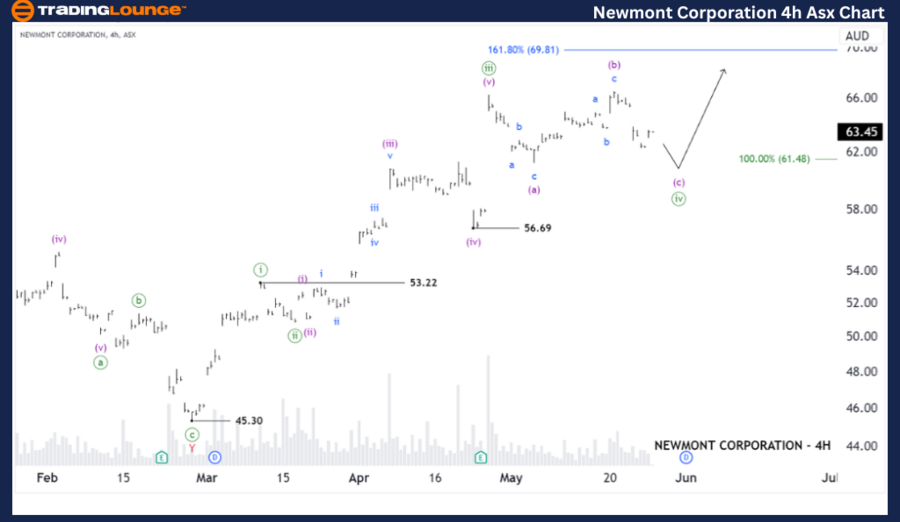
ASX: NEWMONT CORPORATION - NEM  Elliott Wave Technical Analysis TradingLounge (4-Hour Chart)

ASX: NEWMONT CORPORATION - NEM  Elliott Wave Technical Analysis

ASX: NEWMONT CORPORATION - NEM  4-Hour Chart Analysis

Function: Major trend (Minute degree, green)

Mode: Motive

Structure: Impulse

Position: Wave (c)-purple of Wave ((iv))-green

Details: The shorter-term outlook indicates that wave ((iv))-green appears to be unfolding as a Flat pattern. Waves (a) and (b)-purple have completed, and now wave (c)-purple is unfolding to push slightly lower, potentially finding support around 61.48. After that, wave ((v))-green can resume to push higher.

Invalidation point: 53.22

Conclusion:  

Our analysis, forecast of contextual trends, and short-term outlook for ASX: NEWMONT CORPORATION - NEM  aim to provide readers with insights into the current market trends and how to capitalize on them effectively. We offer specific price points that act as validation or invalidation signals for our wave count, enhancing the confidence in our perspective. By combining these factors, we strive to offer readers the most objective and professional perspective on market trends.

Technical Analyst: Hua (Shane) Cuong, CEWA-M (Master’s Designation).

Source: visit Tradinglounge.com and learn From the Experts Join TradingLounge Here 

Previous: ASX: ASX LIMITED - ASX Elliott Wave Technical Analysis

Special Trial Offer - 0.76 Cents a Day for 3 Months! Click here

Access 7 Analysts Over 170 Markets Covered. Chat Room With Support

Newmont-Corporation-...

Related

Nvidia Corporation (NVDA) Stock Analysis: NVDA Elliott Wave Forecast, Technical Outlook, and Trend Reversal Insights

Nvidia Corporation (NVDA) Stock Analysis: NVDA Elliott Wave Forecast, Technical Outlook, and Trend Reversal Insights

Elliott Wave analysis of NVIDIA Corp. (NVDA), highlighting corrective patterns on the daily and 1-ho...

Read More >
Forex Traders Can Gain Insights into Upcoming EURGBP Trends: Euro/British Pound Forex Elliott Wave Technical Analysis

Forex Traders Can Gain Insights into Upcoming EURGBP Trends: Euro/British Pound Forex Elliott Wave Technical Analysis

This article provides an in-depth EURGBP Elliott Wave analysis, focusing on both daily and 4-hour ch...

Read More >
USD/JPY Elliott Wave Technical Analysis: U.S. Dollar/Japanese Yen Detailed Daily and 4-Hour Chart Insights for Forex Traders

USD/JPY Elliott Wave Technical Analysis: U.S. Dollar/Japanese Yen Detailed Daily and 4-Hour Chart Insights for Forex Traders

Our USD/JPY Elliott Wave Analysis provides an in-depth look at the U.S. Dollar/Japanese Yen market u...

Read More >
SPDR Select Sector Fund ETF – XLF Elliott Wave Analysis Projects Wave 3 Breakout with Key Support and Bullish ETF Trading Opportunity

SPDR Select Sector Fund ETF – XLF Elliott Wave Analysis Projects Wave 3 Breakout with Key Support and Bullish ETF Trading Opportunity

XLF is in a bullish wave 3 with targets beyond $52.64. This Elliott Wave analysis highlights key bre...

Read More >
Apple Stock Forecast Using Elliott Wave Analysis Shows Bullish Move in Wave {c} With Targets at $224 and $244 via Fibonacci

Apple Stock Forecast Using Elliott Wave Analysis Shows Bullish Move in Wave {c} With Targets at $224 and $244 via Fibonacci

AAPL Elliott Wave analysis showing a flat corrective structure with upside potential. Key targets ar...

Read More >
British Pound/U.S.Dollar(GBPUSD) Forex Elliott Wave Technical Analysis: Day and 4-Hour Charts Overview

British Pound/U.S.Dollar(GBPUSD) Forex Elliott Wave Technical Analysis: Day and 4-Hour Charts Overview

This article offers a comprehensive guide to trading the GBP/USD pair using the Elliott Wave theory....

Read More >

$1 for 2 Weeks

then $29 a month!

What a Special Offer!

Trade Recommendations

Unleash the power of deversified trading with our comprehensive portfolio, covering 250+ markets:

  • Stock Trades
  • Crypto Trades
  • Forex Trades
  • Commodity Trades
Elliott Wave Analysis

Gain a competitive edge with expert insights and AI-powered Elliott Wave charting into:

  • Global Indices
  • US Stocks & ASX Stocks
  • Forex & Crypto
  • Commodities
Top-Notch Trading Tools

Equip yourself with the tools of success:

  • Real-time Chat rooms
  • Elliott Wave Algorithm
  • Portfolio tools
  • TradingLevels
  • Screener
  • Trading Game
7 Elliott Wave Analysts

Stay ahead of the market with daily charts and insightful videos
Your secret to strategic trading!

JOIN HERE


Welcome to TradingLounge (ASIC A.R.No. 321187), specialists in trades, trading education and technical analysis, covering stocks, indices, commodities, forex and cryptocurrencies.

When you join TradingLounge you have access to everything we offer, including trade tools, educational content and a social platform to chat with like-minded investors.

Read more

@Copyright 2024 by tradinglounge.com

Contact Us

Australian no: 02 4787 6020

International no: +61 (2) 47876020

Pay with:

Find us on