NIFTY 50 INDEX Elliott Wave Technical Analysis – NIFTY (1D Chart)
NIFTY 50 Elliott Wave Technical Analysis
Function: Counter Trend (Minor Degree, Grey)
Mode: Corrective
Structure: Zigzag Complete at Minute Degree
Position: Minute Wave ((c))
Details:
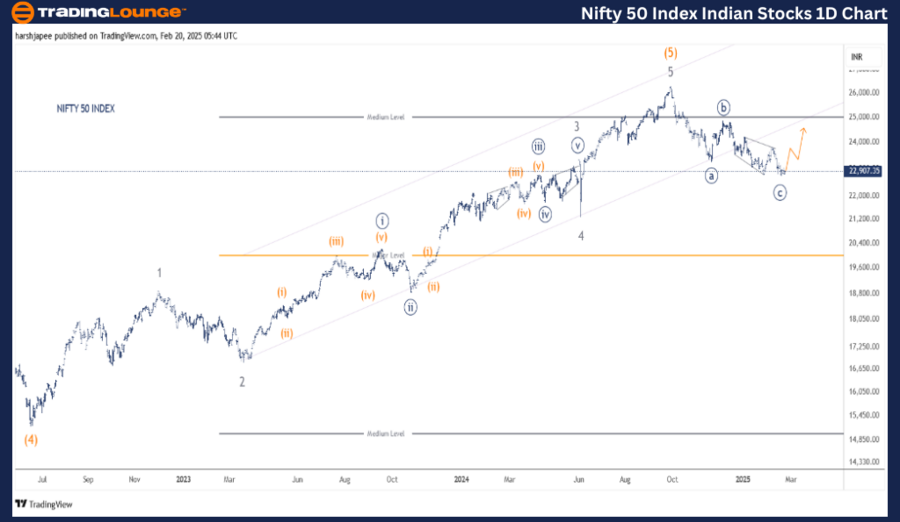
- The alternate wave count is now the primary scenario, indicating a completed Zigzag structure at Minute degree ((a)) - ((b)) - ((c)).
- The 22,700 - 22,800 price range could act as a potential termination zone for Minute Wave ((c)), setting the stage for a counter-trend rally in the near term.
- A break above 23,800 would further validate the bullish move.
Invalidation Point: 26,400
NIFTY 50 INDEX - Daily Chart Technical Analysis & Elliott Wave Projections
The NIFTY 50 daily chart analysis suggests that a major top was established around 26,300 in September 2024.
High-Probability Elliott Wave Count:
- The index completed Minute Wave ((a)) near 23,267, followed by Wave ((b)) and ((c)), which progressed to 24,900 and then dropped to the 22,700 - 22,800 zone.
- Earlier, the index had marked Intermediate Wave (4) Orange near 15,200, followed by a Minor Degree impulse wave (1-5) that propelled prices to 26,300, confirming Wave (5)'s completion.
- Bulls could attempt a rally towards the 24,900 - 25,100 range in the near term. Alternatively, if the correction concludes at 22,700, the index may push higher, targeting 26,300.
NIFTY 50 INDEX Elliott Wave Technical Analysis – NIFTY (4H Chart)
Function: Counter Trend (Minor Degree, Grey)
Mode: Corrective
Structure: Zigzag Complete at Minute Degree
Position: Minute Wave ((c))
Details:
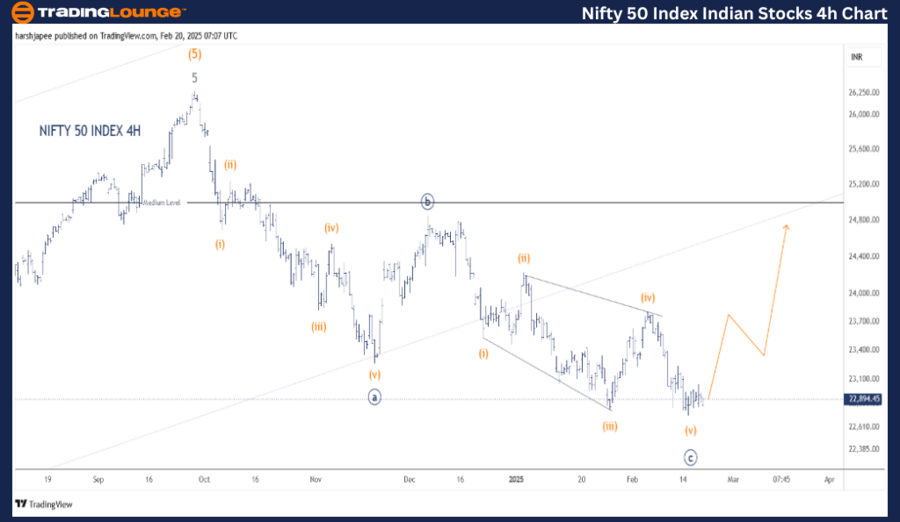
- The alternate count remains favored, with the Zigzag pattern appearing complete at Minute Degree ((a)) - ((b)) - ((c)).
- Minute Wave ((c)) may have developed as an ending diagonal structure.
- The 22,700 - 22,800 zone remains a critical support, potentially signaling a counter-trend rally.
- A break above 23,800 would further confirm bullish momentum.
Invalidation Point: 26,400
NIFTY 50 INDEX - 4H Chart Technical Analysis & Elliott Wave Projections
The NIFTY 50 4H chart illustrates potential wave structure adjustments since the index peaked at 26,280 - 26,300 on September 27, 2024.
Updated Elliott Wave Count:
- The ((a)) - ((b)) - ((c)) Zigzag correction appears completed from the 26,280 highs.
- The initial drop to 23,257 is labeled as Minute Wave ((a)), followed by Wave ((b)) reaching 24,900.
- Minute Wave ((c)) likely formed as a diagonal structure, completing near 22,700 - 22,800.
Next Possible Scenarios:
Counter-trend rally: The index could move towards the 24,400 - 24,500 zone, forming part of a larger-degree correction.
Bullish breakout: A strong push higher could see the index aiming for new highs above 26,300.
Confirmation: A break above 23,900 would signal that bulls are regaining control.
Technical Analyst: Harsh Japee
Source: visit Tradinglounge.com and learn From the Experts Join TradingLounge Here
Previous: CAC 40 (France) Elliott Wave Technical Analysis
VALUE Offer - Buy 1 Month & Get 3 Months!Click here
Access 7 Analysts Over 200 Markets Covered. Chat Room With Support
Conclusion
The NIFTY 50 INDEX is positioned for a potential upside move, with prices likely progressing towards the 25,000 - 25,100 zone as part of a larger-degree corrective structure.
📢 Exclusive for TradingLounge Subscribers:
Get daily trade setup videos featuring Elliott Wave counts and detailed technical analysis of the NIFTY 50 INDEX.