27Feb

XRP Ripple Elliott Wave Analysis: Market Trends, Support & Resistance Levels, and Technical Forecast for XRPUSD

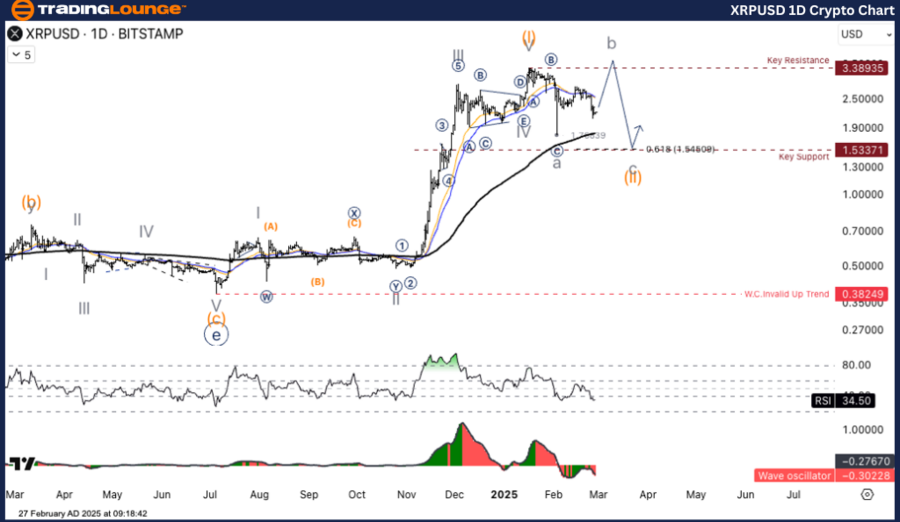
XRP/ U.S. Dollar (XRPUSD) Elliott Wave Analysis – TradingLounge Daily Chart

XRPUSD Elliott Wave Technical Analysis

Function: Counter Trend

Mode: Corrective

Structure: Flat

Position: Wave ((B))

Next Higher Degree Direction: Wave IV

Wave Cancellation Level: Not specified

Analysis Details:

The XRPUSD price structure indicates a continuing downward correction within Corrective Wave (B). There is still room for further downside movement before potential stabilization, suggesting traders should monitor key support levels.

XRP/ U.S. Dollar (XRPUSD) Trading Strategy

XRP has completed Wave (I) and is now in a bearish correction phase (Wave (II)). Before transitioning into the final corrective leg (Wave C), a short-term recovery (Wave B up) may occur. The projected key support level for Wave C is 1.533 USD.

Trading Strategy

Long Strategy

Entry: Buy when price retraces to a key support level

  • If XRP tests the $1.533 support zone and buying pressure strengthens, a long entry may be considered.
  • Target Profit Range: Between 2.50 - 3.38 USD

Risk Management:

  • If XRP drops below 1.533 USD, traders should reassess their positions and apply risk mitigation strategies.

XRPUSD-1d-crypto-cha...


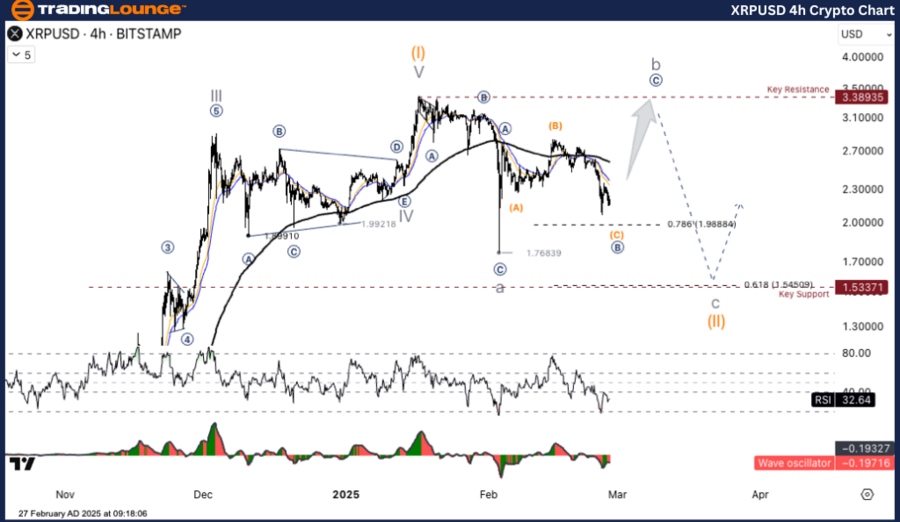
XRP/ U.S. Dollar (XRPUSD) Elliott Wave Analysis – TradingLounge H4 Chart

XRPUSD Elliott Wave Technical Analysis

Function: Counter Trend

Mode: Corrective

Structure: Flat

Position: Wave ((B))

Next Higher Degree Direction: Wave IV

Wave Cancellation Level: Not specified

Analysis Details:

The XRPUSD market remains in a corrective phase within Wave (B), indicating further downside potential before a trend reversal takes place. Traders should watch for key support confirmations before making trading decisions.

XRP/ U.S. Dollar (XRPUSD) Trading Strategy

XRP has completed Wave (I) and is undergoing a corrective decline in Wave (II). A temporary rebound (Wave B up) may precede the final Wave C leg, where the 1.533 USD level serves as a critical support zone.

Trading Strategy

Long Strategy

Entry: Buy when price retraces to a key support level

  • If XRP reaches the $1.533 support and buying momentum returns, traders may consider a long position.
  • Target Profit Range: Between 2.50 - 3.38 USD

Risk Management:

  • If the price falls below 1.533 USD, traders should reassess their positions to avoid potential losses.

Technical Analyst: Kittiampon Somboonsod, CEWA

Source: visit Tradinglounge.com and learn From the Experts Join TradingLounge Here 

Previous: SOLUSD Elliott Wave Technical Analysis

VALUE Offer - Buy 1 Month & Get 3 Months!Click here

Access 7 Analysts Over 200 Markets Covered. Chat Room With Support

XRPUSD-4h-crypto-cha...

Related

Key Phases in the Iron Ore Market and Future Price Predictions using the Iron Ore Commodity Elliott Wave Technical Analysis

Key Phases in the Iron Ore Market and Future Price Predictions using the Iron Ore Commodity Elliott Wave Technical Analysis

Stay informed with our comprehensive iron ore price forecast and Elliott Wave analysis. We cover ess...

Read More >
Diminishing Trading Volume Hints at Market Top Ahead of Tech Giants' Earnings

Diminishing Trading Volume Hints at Market Top Ahead of Tech Giants' Earnings

Over the past two months, trading volumes for the S&P 500 (SPX) and the NASDAQ 100 (NDX) have been d...

Read More >
Expert Forecasts, Technical Indicators, and Market Insights: Uniswap Crypto Price News Today Elliott Wave Technical Analysis

Expert Forecasts, Technical Indicators, and Market Insights: Uniswap Crypto Price News Today Elliott Wave Technical Analysis

Explore detailed Uniswap (UNIUSD) Elliott Wave analysis with insights into price predictions and mar...

Read More >
Ripple (XRP) Crypto Price News Today and XRPUSD Elliott Wave Technical Analysis: XRP Price Forecast and Trading Strategy

Ripple (XRP) Crypto Price News Today and XRPUSD Elliott Wave Technical Analysis: XRP Price Forecast and Trading Strategy

XRPUSD is completing a Wave 2 A-B-C correction. Watch for bullish signals around $1.90–$1.88 to ent...

Read More >
KOSPI Composite is in a Bullish Trend - KOSPI Elliott Wave Technical Analysis on the Daily and Weekly Charts

KOSPI Composite is in a Bullish Trend - KOSPI Elliott Wave Technical Analysis on the Daily and Weekly Charts

The KOSPI Composite is in a bullish trend, confirmed by Elliott Wave analysis on the daily and weekl...

Read More >
BNBUSD Elliott Wave Analysis: A Comprehensive Guide to Binance Coin Trading Strategies 9 February 24

BNBUSD Elliott Wave Analysis: A Comprehensive Guide to Binance Coin Trading Strategies 9 February 24

Explore BNBUSD Elliott Wave analysis for February 9, 2024, and discover effective trading strategies...

Read More >

Buy 1 Month

Get 3 Months!

Special Offer:

Trade Recommendations

Unleash the power of deversified trading with our comprehensive portfolio, covering:

  • Stock Trades
  • Crypto Trades
  • Forex Trades
  • Commodity Trades
Elliott Wave Analysis

Gain a competive edge with expert insights in to:

  • Global Indices
  • US Stocks & ASX Stocks
  • Forex & Crypto
  • Commodities
Top-Notch Trading Tools

Equip yourself with the tools of success:

  • Social Chat
  • Elliott Wave Algorithm
  • Screener
  • TradingLevels
  • Trading Game
7 Elliott Wave Analysts

Stay ahead of the market with daily charts and insightful videos
-Your secret to strategic trading!

JOIN HERE


Welcome to TradingLounge (ASIC A.R.No. 321187), specialists in trades, trading education and technical analysis, covering stocks, indices, commodities, forex and cryptocurrencies.

When you join TradingLounge you have access to everything we offer, including trade tools, educational content and a social platform to chat with like-minded investors.

Read more

@Copyright 2024 by tradinglounge.com

Contact Us

Australian no: 02 4787 6020

International no: +61 (2) 47876020

Pay with:

Find us on