Fortinet Inc. (FTNT) Elliott Wave Analysis – TradingLounge Daily Chart Overview
FTNT Elliott Wave Technical Analysis
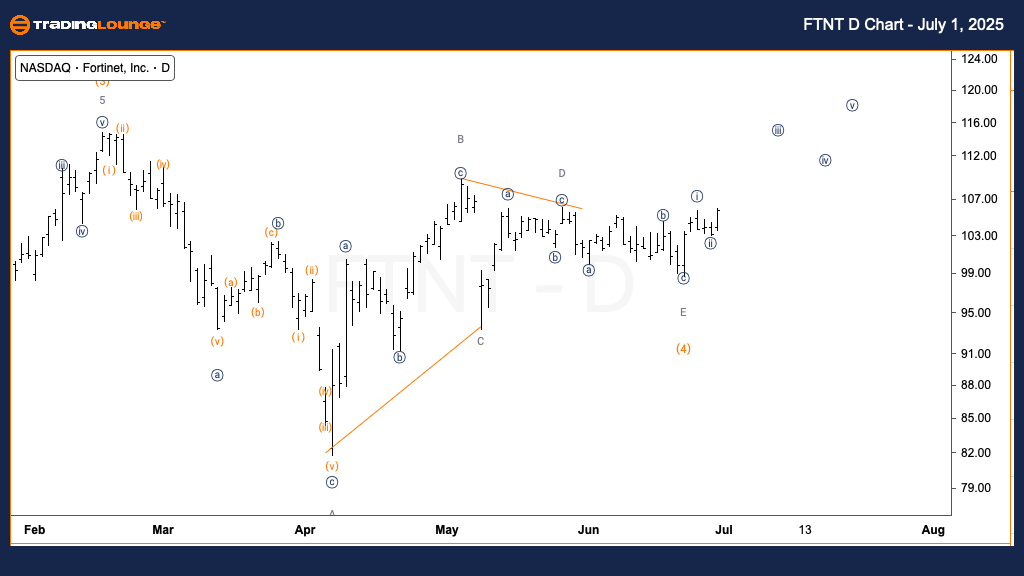
Function: Trend
Mode: Impulsive
Structure: Motive
Position: Wave 1 of (5)
Direction: Uptrend beginning in Wave 1
Details: The recent triangle pattern completion suggests Wave (4) is finished. With price stability above $100, the next directional move is upward continuation in Wave 1.
Fortinet Inc. (NASDAQ: FTNT) is indicating a new upward trend on the daily timeframe, based on Elliott Wave structure. The completed Wave (4) formed a recognizable triangle consolidation, establishing a base for the anticipated start of Wave (5). Price support consistently holding above the $100 threshold supports the emergence of Wave 1 of (5), reinforcing a positive technical outlook and suggesting a bullish continuation is underway.
Fortinet Inc. (FTNT) Elliott Wave Analysis – TradingLounge 1-Hour Chart Overview
FTNT Elliott Wave Technical Analysis
Function: Trend
Mode: Impulsive
Structure: Motive
Position: Wave {iii} of 1
Direction: Bullish acceleration in Wave {iii}
Details: Wave {ii} appears completed. A minor retracement may occur in Wave (ii) of {iii} before price resumes its upward path.
The short-term 1-hour chart analysis confirms the broader bullish pattern, showing clear development into Wave {iii} of 1. After completing Wave {ii}, the market may see a small correction within Wave (ii) of {iii}. However, the prevailing trend remains firmly upward, with likely acceleration as the impulsive wave sequence continues, aligning with bullish Elliott Wave projections for Fortinet’s stock.
Technical Analyst: Alessio Barretta
Source: Visit Tradinglounge.com and learn from the Experts. Join TradingLounge Here
Previous: Amazon.com Inc. (AMZN) Elliott Wave Technical Analysis
VALUE Offer - $1 for 2 Weeks then $29 a month!Click here
Access 7 Analysts Over 200 Markets Covered. Chat Room With Support
