ADANI GREEN ENERGY – ADANIGREEN Elliott Wave Analysis (1D Chart)

ADANIGREEN Elliott Wave Technical Analysis

Trend Overview: Larger Degree Trend Higher (Intermediate Degree, Orange)

Mode: Motive

Structure: Impulse

Position: Minute Wave ((ii)) Navy

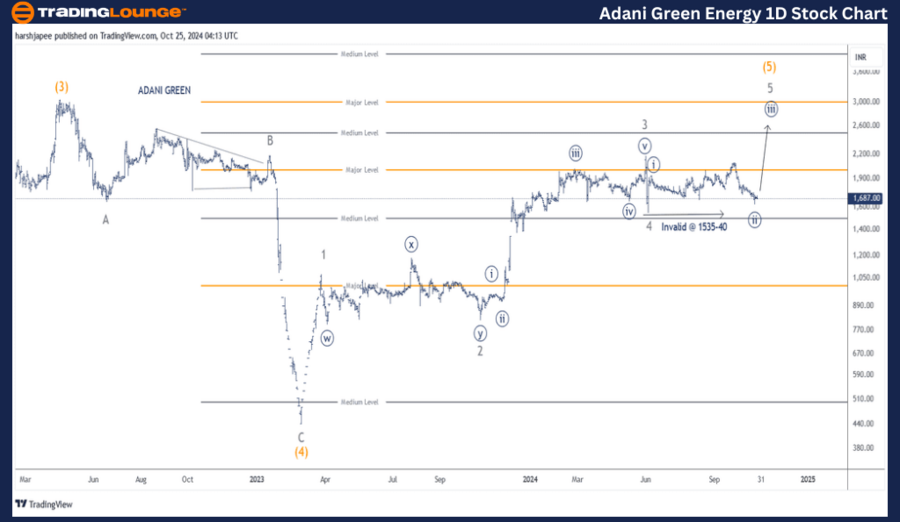
Analysis: The 1D chart of ADANI GREEN ENERGY suggests that Minute Wave ((iii)) Navy is likely to continue advancing within Minor Wave 5 Grey of Intermediate Wave (5) Orange, as long as the 1535-1540 support level holds. A decline below this range would prompt a reevaluation of the current wave count, necessitating caution for long positions.

Invalidation Level: 1535

ADANI GREEN ENERGY Daily Chart – Elliott Wave Analysis and Potential Counts

The daily analysis of ADANIGREEN ENERGY indicates that Intermediate Wave (5) could extend upwards, potentially reaching the 3050 level in the longer term. Currently, the stock has dropped to 1636, and maintaining levels above 1535 is crucial to preserve the bullish outlook.

In March 2023, ADANIGREEN Energy concluded Intermediate Wave (4) around the 430 mark, having previously surged to a high of 3050 in Intermediate Wave (3). Following this, the stock retraced sharply to 430 in a corrective A-B-C flat pattern. Since this correction, Intermediate Wave (5) appears to be progressing upwards.

Minor Waves 1 through 4 seem complete, and Minor Wave 5 might be in progress against the 1535 level. A drop below 1535 would invalidate the bullish wave count.

Adani-Green-Energy-1...


ADANI GREEN ENERGY – ADANIGREEN Elliott Wave Analysis (4H Chart)

Trend Overview: Larger Degree Trend Higher (Intermediate Degree, Orange)

Mode: Motive

Structure: Impulse

Position: Minute Wave ((ii)) Navy

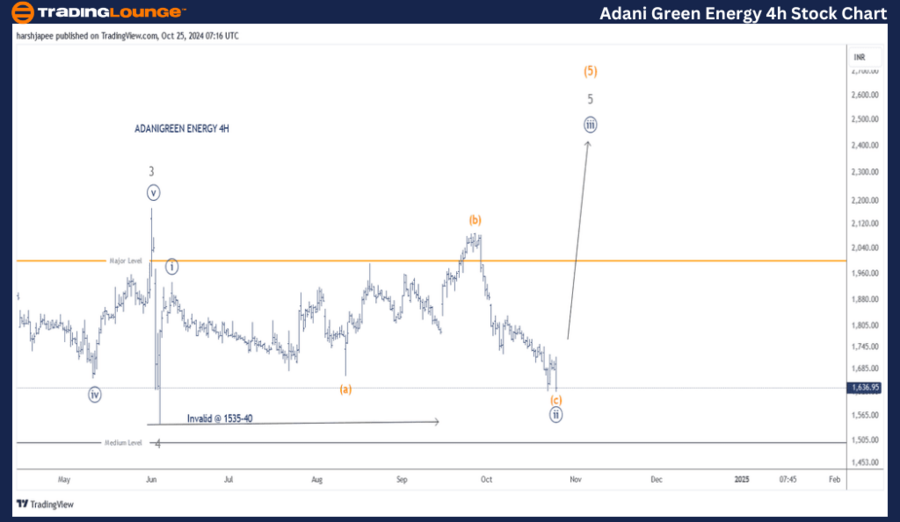
Analysis: The 4H chart analysis shows that Minute Wave ((iii)) Navy may resume its upward path within Minor Wave 5 Grey of Intermediate Wave (5) Orange, as long as the 1535-1540 support holds. There is also the potential that Minute Wave ((ii)) completed as an expanded flat. A break below this range would signal the need for a revised wave count, warranting caution.

Invalidation Level: 1535

ADANI GREEN ENERGY 4H Chart – Technical Analysis and Elliott Wave Counts

The 4H chart of ADANIGREEN Energy presents the wave structure from Minor Wave 3 onward. Notably, Minor Wave 4 completed around the 1535-1540 range on June 5, 2024. Currently, Minor Wave 5 appears to be unfolding. At the time of writing, Minute Wave ((ii)) could be complete around the 160 range, and if accurate, Minute Wave ((iii)) might soon resume its upward trend.

Technical Analyst: Harsh Japee

Source: visit Tradinglounge.com and learn From the Experts Join TradingLounge Here 

Previous: TATA Consumer Product Elliott Wave Technical Analysis

VALUE Offer - Buy 1 Month & Get 3 Months!Click here

Access 7 Analysts Over 200 Markets Covered. Chat Room With Support

Adani-Green-Energy-4...


Conclusion:

ADANI GREEN ENERGY seems poised to initiate Minute Wave ((iii)) upwards, within Minor Wave 5 of Intermediate Wave (5) Orange, as long as prices remain above the 1535 level.

Related

Silver (XAGUSD) Price and Elliott Wave Technical Analysis: Buy the Dip for Profitable Silver Trading

Silver (XAGUSD) Price and Elliott Wave Technical Analysis: Buy the Dip for Profitable Silver Trading

This comprehensive guide offers valuable insights into Silver trading, covering essential topics suc...

Read More >
Unlocking ASX Trading Success: WISETECH GLOBAL LIMITED - WTC Stock Analysis & Elliott Wave Technical Forecast

Unlocking ASX Trading Success: WISETECH GLOBAL LIMITED - WTC Stock Analysis & Elliott Wave Technical Forecast

Elliott Wave analysis of WiseTech Global Limited (WTC) on the ASX offers a detailed breakdown of th...

Read More >
Elliott Wave Analysis of Dow Jones (DJI): Insights on Corrective Phase with Orange Wave B and Navy Blue Wave 4 Trends

Elliott Wave Analysis of Dow Jones (DJI): Insights on Corrective Phase with Orange Wave B and Navy Blue Wave 4 Trends

The Dow Jones Industrial Average (DJI) using Elliott Wave Theory highlights the progression of orang...

Read More >
Reece Limited - REH Stock Analysis & Elliott Wave Technical Analysis of REH's Impulse Waves, Expected Support and Resistance Levels

Reece Limited - REH Stock Analysis & Elliott Wave Technical Analysis of REH's Impulse Waves, Expected Support and Resistance Levels

Our detailed Elliott Wave analysis of Reece Limited (REH) on the ASX provides key insights into curr...

Read More >
Learn about BTC price movements, trading strategies, and technical indicators: Bitcoin (BTCUSD) Elliott Wave analysis

Learn about BTC price movements, trading strategies, and technical indicators: Bitcoin (BTCUSD) Elliott Wave analysis

Get an in-depth Elliott Wave analysis of Bitcoin (BTCUSD) on both daily and 4-hour charts. Learn abo...

Read More >

Buy 1 Month

Get 3 Months!

Special Offer:

Trade Recommendations

Unleash the power of deversified trading with our comprehensive portfolio, covering:

  • Stock Trades
  • Crypto Trades
  • Forex Trades
  • Commodity Trades
Elliott Wave Analysis

Gain a competive edge with expert insights in to:

  • Global Indices
  • US Stocks & ASX Stocks
  • Forex & Crypto
  • Commodities
Top-Notch Trading Tools

Equip yourself with the tools of success:

  • Social Chat
  • Elliott Wave Algorithm
  • Screener
  • TradingLevels
  • Trading Game
7 Elliott Wave Analysts

Stay ahead of the market with daily charts and insightful videos
-Your secret to strategic trading!

JOIN HERE


Welcome to TradingLounge (ASIC A.R.No. 321187), specialists in trades, trading education and technical analysis, covering stocks, indices, commodities, forex and cryptocurrencies.

When you join TradingLounge you have access to everything we offer, including trade tools, educational content and a social platform to chat with like-minded investors.

Read more

@Copyright 2024 by tradinglounge.com

Contact Us

Australian no: 02 4787 6020

International no: +61 (2) 47876020

Pay with:

Find us on