MercadoLibre Inc. (MELI) Elliott Wave Analysis
This analysis of MercadoLibre Inc. (MELI) dives into both the daily and 1-hour charts, applying Elliott Wave Theory to analyze current market patterns and forecast potential price trajectories.
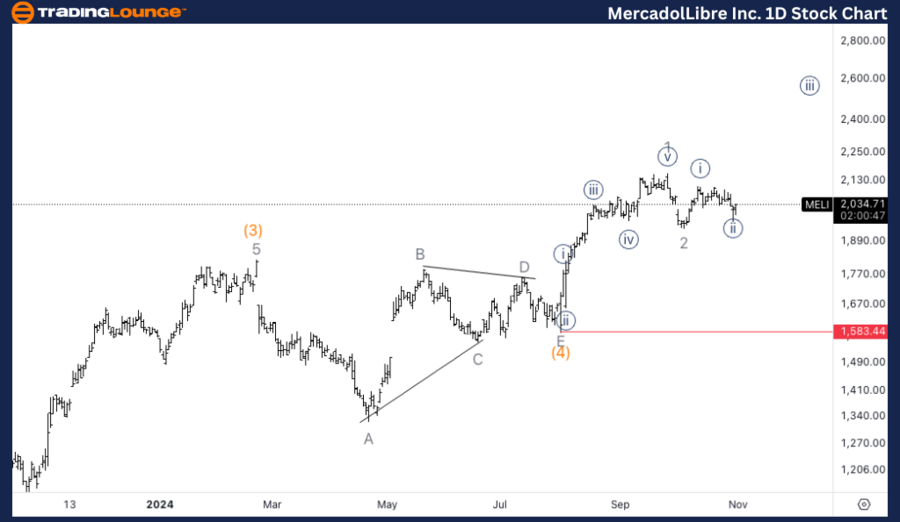
MELI Elliott Wave Analysis: TradingLounge Daily Chart
MercadoLibre Inc. (MELI) Daily Chart Analysis
MELI Elliott Wave Technical Analysis
FUNCTION: Trend
MODE: Impulsive
STRUCTURE: Motive
POSITION: Wave 3 of (5)
DIRECTION: Upside in Wave 3
DETAILS: The ongoing wave (5) suggests further upside potential, with targets around the $3000 level, influenced by the measured length of wave 1 and recent upward momentum.
MELI Elliott Wave Technical Analysis – Daily Chart
The daily chart analysis shows that MELI is currently in wave 3 of (5), demonstrating strong bullish momentum. This wave is projected to continue climbing, with price targets possibly extending to $3000. The bullish outlook remains intact, and traders should monitor for additional upward moves as wave 3 progresses.

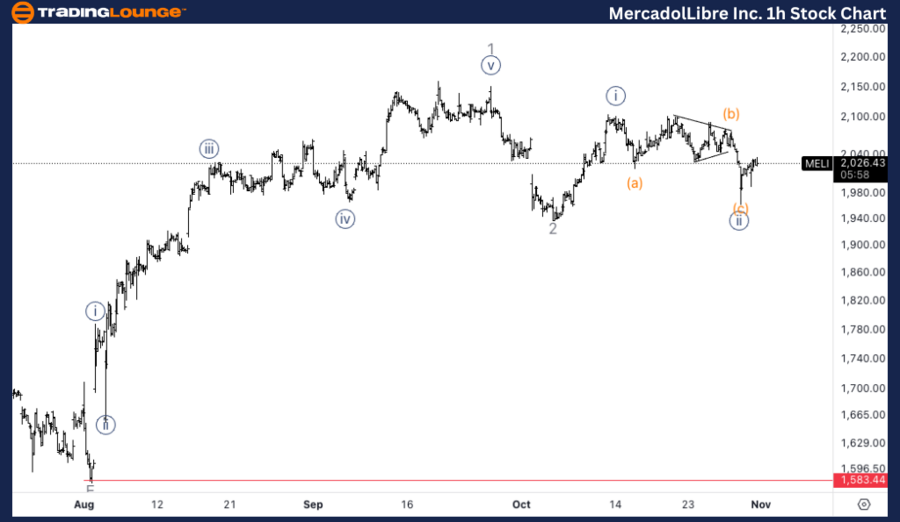
TradingLounge MercadoLibre Inc. (MELI) 1-Hour Chart
MELI Elliott Wave Technical Analysis
FUNCTION: Trend
MODE: Impulsive
STRUCTURE: Motive
POSITION: Wave {ii} of 3
DIRECTION: Forming a bottom in Wave {ii}
DETAILS: In wave {ii}, a triangle pattern in wave (b) indicates a likely three-wave corrective move aligning with the wave {ii} narrative.
MELI Elliott Wave Technical Analysis – 1-Hour Chart
On the 1-hour chart, MELI appears to be in a corrective phase within wave {ii} of its broader uptrend. The observed triangle pattern in wave (b) supports the idea of a three-wave corrective sequence. The anticipated outcome is the completion of this correction, setting the stage for continued upward momentum in wave {iii}.
Technical Analyst: Alessio Barretta
Source: visit Tradinglounge.com and learn From the Experts Join TradingLounge Here
See Previous: PayPal Holdings Inc Elliott Wave Technical Analysis
VALUE Offer - Buy 1 Month & Get 3 Months!Click here
Access 7 Analysts Over 200 Markets Covered. Chat Room With Support
