ASX: SANTOS LIMITED - STO Elliott Wave Technical Analysis TradingLounge (1D Chart)

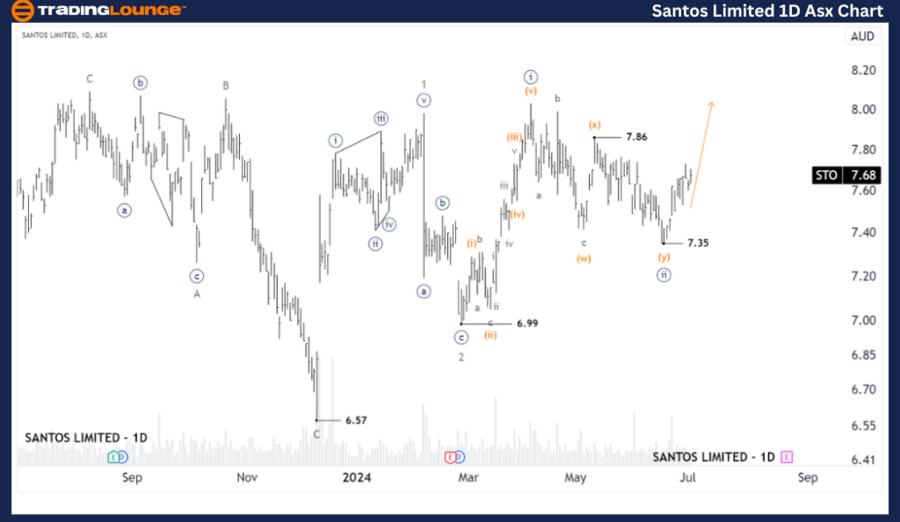
Greetings, Our Elliott Wave analysis today updates the Australian Stock Exchange (ASX) with SANTOS LIMITED - STO. We see that the STO may have completed wave ((ii))-navy at the low at 7.35, which also allows wave ((iii))-navy to be opened to push higher.

ASX: SANTOS LIMITED - STO Elliott Wave Technical Analysis

ASX: SANTOS LIMITED - STO 1D Chart (Semilog Scale) Analysis

Function: Major trend (Minor degree, grey)

Mode: Motive

Structure: Impulse

Position: Wave ((iii))-navy of Wave 3-grey

Details: The short-term outlook suggests that wave ((iii))-navy is perhaps opening up to push higher, a rise above 7.86 would clarify this view.

Invalidation point: 7.35

Confirmation point: 7.86

Santos-Limited-1D-As...


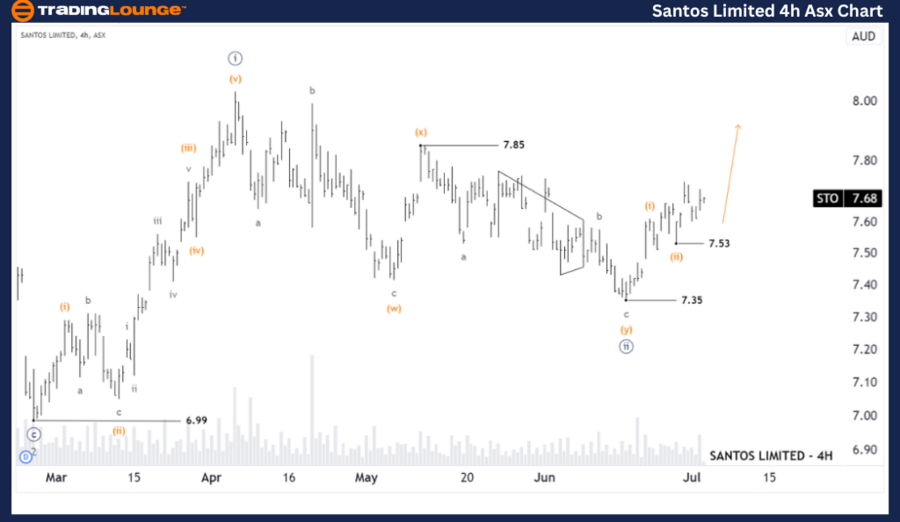
SANTOS LIMITED - STO Elliott Wave Analysis TradingLounge (4-Hour Chart)

ASX: SANTOS LIMITED - STO Elliott Wave Technical Analysis

ASX: SANTOS LIMITED - STO 4-Hour Chart Analysis

Function: Major trend (Minuette degree, orange)

Mode: Motive

Structure: Impulse

Position: Wave (iii)-orange of Wave ((iii))-navy of Wave 3-grey

Details: The shorter-term outlook shows that wave ((ii))-navy seems to have just ended and wave ((iii))-navy is opening to push higher. Currently the price action is breaking down into waves (i),(ii)-orange and they have ended, wave (iii)-orange may be returning to push higher. However, pushing higher than 7.85 will further clarify this outlook.

Invalidation point: 7.35

Technical Analyst: Hua (Shane) Cuong, CEWA-M (Master’s Designation).

Source: visit Tradinglounge.com and learn From the Experts Join TradingLounge Here 

Previous: WISETECH GLOBAL LIMITED - WTC Elliott Wave Technical Analysis

Special Trial Offer - 0.76 Cents a Day for 3 Months! Click here

Access 7 Analysts Over 170 Markets Covered. Chat Room With Support

Santos-Limited-4h-As...

Conclusion:

Our analysis, forecast of contextual trends, and short-term outlook for ASX: SANTOS LIMITED - STO aim to provide readers with insights into the current market trends and how to capitalize on them effectively. We offer specific price points that act as validation or invalidation signals for our wave count, enhancing the confidence in our perspective. By combining these factors, we strive to offer readers the most objective and professional perspective on market trends.

Related

Unlocking Market Potential: SP500 at 5000 and Nasdaq 100 at 18000 Resistances - Elliott Wave Analysis Update

Unlocking Market Potential: SP500 at 5000 and Nasdaq 100 at 18000 Resistances - Elliott Wave Analysis Update

SP500 at 5000, Nasdaq 100 near 18000 resistance. Markets may temporarily breach, but gravitational p...

Read More >
Commodity Corn: Elliott Wave analysis of Corn Prices Reveals Ongoing Bearish Trends and Potential Trading Opportunities

Commodity Corn: Elliott Wave analysis of Corn Prices Reveals Ongoing Bearish Trends and Potential Trading Opportunities

Our detailed Elliott Wave analysis of Corn prices reveals ongoing bearish trends and potential tradi...

Read More >
Elliott Wave Trading Strategies: SP500, NASDAQ, DAX, ASX – July 10, 2025 Market Forecast

Elliott Wave Trading Strategies: SP500, NASDAQ, DAX, ASX – July 10, 2025 Market Forecast

US indices SP500 and NASDAQ continue rising in Wave v) of 3 of (1), while DAX, FTSE, and ASX prepare...

Read More >
Insurance Australia Group (IAG) Stock Elliott Wave Forecast Suggests Bearish Move With Key Resistance Based on ASX Analysis

Insurance Australia Group (IAG) Stock Elliott Wave Forecast Suggests Bearish Move With Key Resistance Based on ASX Analysis

Technical analysis of IAG using Elliott Wave theory signals a potential bearish move toward 7.79, wi...

Read More >
Australian Dollar/U.S. Dollar (AUDUSD) Elliott Wave Analysis Reveals Market Trends, and Trading Insights for Forex Traders

Australian Dollar/U.S. Dollar (AUDUSD) Elliott Wave Analysis Reveals Market Trends, and Trading Insights for Forex Traders

AUDUSD provides traders with insights into current market trends, wave patterns, and potential price...

Read More >
NIFTY 50 Elliott Wave Forecast Shows Ongoing Bullish Momentum with Wave 3 and 1 on Daily and Weekly Technical Charts

NIFTY 50 Elliott Wave Forecast Shows Ongoing Bullish Momentum with Wave 3 and 1 on Daily and Weekly Technical Charts

This article presents a comprehensive Elliott Wave analysis of the NIFTY 50 Index, utilising both da...

Read More >

$1 for 2 Weeks

then $29 a month!

What a Special Offer!

Trade Recommendations

Unleash the power of deversified trading with our comprehensive portfolio, covering 250+ markets:

  • Stock Trades
  • Crypto Trades
  • Forex Trades
  • Commodity Trades
Elliott Wave Analysis

Gain a competitive edge with expert insights and AI-powered Elliott Wave charting into:

  • Global Indices
  • US Stocks & ASX Stocks
  • Forex & Crypto
  • Commodities
Top-Notch Trading Tools

Equip yourself with the tools of success:

  • Real-time Chat rooms
  • Elliott Wave Algorithm
  • Portfolio tools
  • TradingLevels
  • Screener
  • Trading Game
7 Elliott Wave Analysts

Stay ahead of the market with daily charts and insightful videos
Your secret to strategic trading!

JOIN HERE


Welcome to TradingLounge (ASIC A.R.No. 321187), specialists in trades, trading education and technical analysis, covering stocks, indices, commodities, forex and cryptocurrencies.

When you join TradingLounge you have access to everything we offer, including trade tools, educational content and a social platform to chat with like-minded investors.

Read more

@Copyright 2024 by tradinglounge.com

Contact Us

Australian no: 02 4787 6020

International no: +61 (2) 47876020

Pay with:

Find us on