BTCUSD Elliott Wave Analysis: Navigating Bitcoin's Market Movements

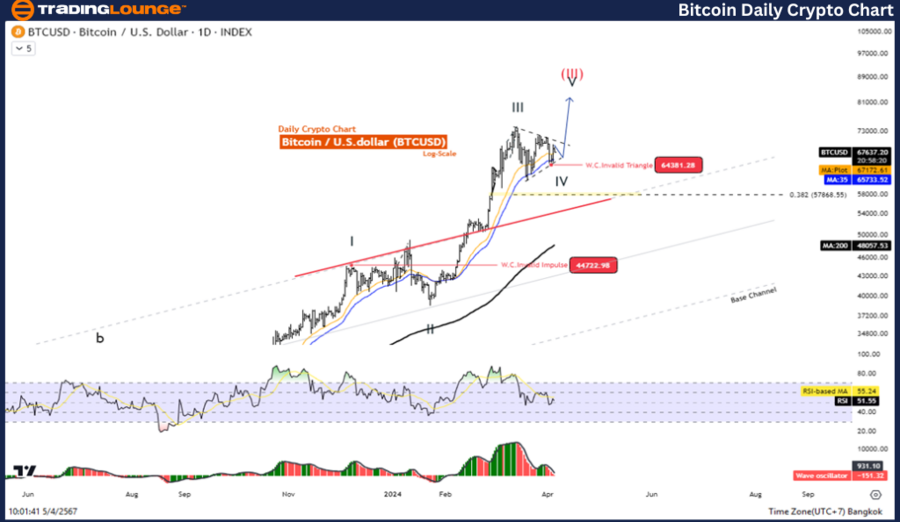
Bitcoin/ U.S. dollar(BTCUSD)  Daily Chart Overview

BTCUSD Elliott Wave Technical Analysis

  • Function: Counter Trend
  • Mode: Corrective Phase
  • Structure: Triangle Formation
  • Current Position: Wave ((D))
  • Upcoming Direction: Towards Wave (III)
  • Critical Threshold: $31,046.25

BTCUSD Analysis Details: We're observing the corrective Wave IV, which sets the stage for an impending ascent in Wave V. This analysis points towards a structured and temporary retracement in Bitcoin's otherwise bullish journey.

BTCUSD Trading Strategy Insights

As we delve into the dynamics of Bitcoin's price movements, it becomes evident that the cryptocurrency is sustaining its upward trajectory. The present scenario outlines a brief pause, characterized by the fourth wave's correction. The unfolding Triangle pattern signals an imminent dip in wave E, subsequently paving the way for a resurgence in the fifth wave. Investors are advised to await the culmination of this correction to capitalize on the continuing uptrend.

BTCUSD Technical Indicator Highlights

The BTCUSD market exhibits strong bullish signals. A significant indicator, the MA200, confirms the ongoing uptrend as prices hold above this key moving average. Additionally, the Wave Oscillator underscores a positive momentum, further bolstering the bullish outlook.

BTCUSD-Day-Crypto-ch...


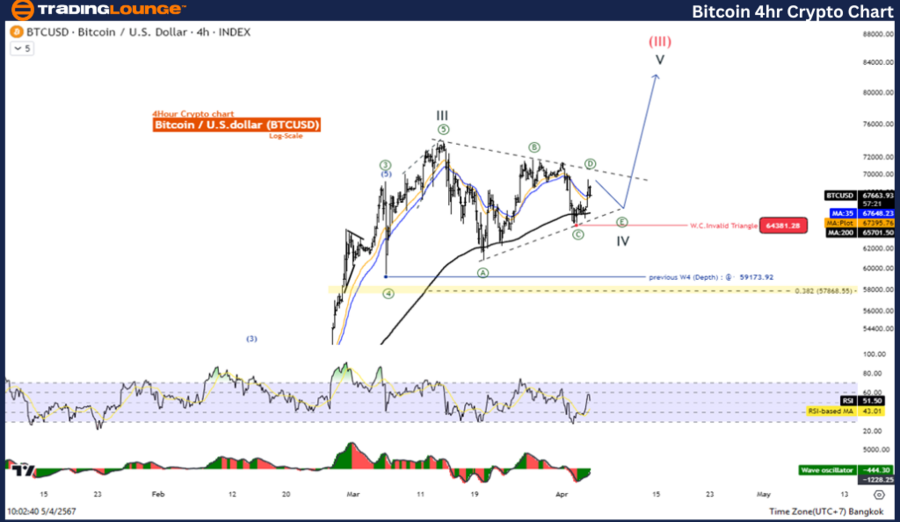
Bitcoin/ U.S. dollar(BTCUSD) 4-Hour (4H) Chart Analysis

BTCUSD Elliott Wave Technical Breakdown

  • Function: Counter Trend

  • Mode: Corrective Phase

  • Structure: Triangle Formation

  • Current Position: Wave ((D))

  • Forecasted Direction: Heading towards Wave (III)

  • Invalidation Level: $31,046.25

In-depth Analysis: The detailed scrutiny of the BTCUSD pair in its 4-hour chart mirrors the daily chart's findings. We're in the midst of the corrective Wave IV, anticipated to be followed by a climb in Wave V, reinforcing the bullish sentiment in the Bitcoin market.

BTCUSD Trading Strategy Considerations

Despite the current phase of correction, Bitcoin maintains its long-term bullish stance. The ongoing fourth-wave correction within the Triangle pattern hints at a forthcoming decline in wave E. This anticipated dip offers a strategic entry point for traders aiming to align with the bullish trend post-correction.

Technical Indicators Overview

The bullish sentiment in the Bitcoin market is further supported by technical indicators. The price's position above the MA200 delineates a clear uptrend, while the Wave Oscillator’s bullish momentum accentuates the positive market sentiment.

Technical Analyst: Kittiampon Somboonsod

Source: visit Tradinglounge.com and learn From the Experts Join TradingLounge Here 

See Previous: Neo/ U.S. dollar(NEOUSD)

TradingLounge Once Off SPECIAL DEAL: Here > 1 month Get 3 months.

TradingLounge's Free Week Extravaganza!

April 14 – 21: Unlock the Doors to Trading Excellence — Absolutely FREE

BTCUSD-4hr-Crypto-ch...

Related

Discover the in-depth Deere & Co.(DE) Stocks Elliott Wave Technical Analysis

Discover the in-depth Deere & Co.(DE) Stocks Elliott Wave Technical Analysis

Discover the in-depth Elliott Wave Analysis for Deere & Co. (DE), focusing on daily and 4-hour chart...

Read More >
Analog Devices Inc.(ADI:NASDAQ) Elliott Wave Technical Analysis 31 October 23

Analog Devices Inc.(ADI:NASDAQ) Elliott Wave Technical Analysis 31 October 23

Analog Devices Inc., Elliott Wave Technical AnalysisAnalog Devices Inc.,  (ADI:NASDAQ): 4H Char...

Read More >
Dogecoin / U.S. dollar(DOGEUSD) Elliott Wave Technical Analysis 6 November 23

Dogecoin / U.S. dollar(DOGEUSD) Elliott Wave Technical Analysis 6 November 23

Dogecoin / U.S. dollar(DOGEUSD) Elliott Wave Technical Analysis 6 November 23, Dogecoin / U.S. dolla...

Read More >
Elliott Wave Analysis: S&P 500, NASDAQ 100, RUT, DAX 40, FTSE 100, ASX200 Trading Strategies

Elliott Wave Analysis: S&P 500, NASDAQ 100, RUT, DAX 40, FTSE 100, ASX200 Trading Strategies

In this Stock Market Report covering S&P 500, NASDAQ 100, RUSSELL 2000, DAX 40, FTSE 100, and ASX 20...

Read More >
Elliott Wave Technical Analysis of Natural Gas Commodity: A Trader's Guide to Market Trends and Predictions

Elliott Wave Technical Analysis of Natural Gas Commodity: A Trader's Guide to Market Trends and Predictions

This article offers a detailed examination of natural gas markets through the lens of Elliott Wave T...

Read More >
Stock Market Analysis: Costco Wholesale Corp.(COST) Elliott Wave Technical Analysis

Stock Market Analysis: Costco Wholesale Corp.(COST) Elliott Wave Technical Analysis

Delve into comprehensive Elliott Wave analysis for Costco Wholesale Corp. (COST), uncovering intrica...

Read More >

Buy 1 Month

Get 3 Months!

Special Offer:

Trade Recommendations

Unleash the power of deversified trading with our comprehensive portfolio, covering:

  • Stock Trades
  • Crypto Trades
  • Forex Trades
  • Commodity Trades
Elliott Wave Analysis

Gain a competive edge with expert insights in to:

  • Global Indices
  • US Stocks & ASX Stocks
  • Forex & Crypto
  • Commodities
Top-Notch Trading Tools

Equip yourself with the tools of success:

  • Social Chat
  • Elliott Wave Algorithm
  • Screener
  • TradingLevels
  • Trading Game
7 Elliott Wave Analysts

Stay ahead of the market with daily charts and insightful videos
-Your secret to strategic trading!

JOIN HERE


Welcome to TradingLounge (ASIC A.R.No. 321187), specialists in trades, trading education and technical analysis, covering stocks, indices, commodities, forex and cryptocurrencies.

When you join TradingLounge you have access to everything we offer, including trade tools, educational content and a social platform to chat with like-minded investors.

Read more

@Copyright 2024 by tradinglounge.com

Contact Us

Australian no: 02 4787 6020

International no: +61 (2) 47876020

Pay with:

Find us on