24Jun

KOSPI Composite Elliott Wave Forecast Shows Bullish Trend Forming in Gray Wave 3 With Technical Insights and Market Analysis

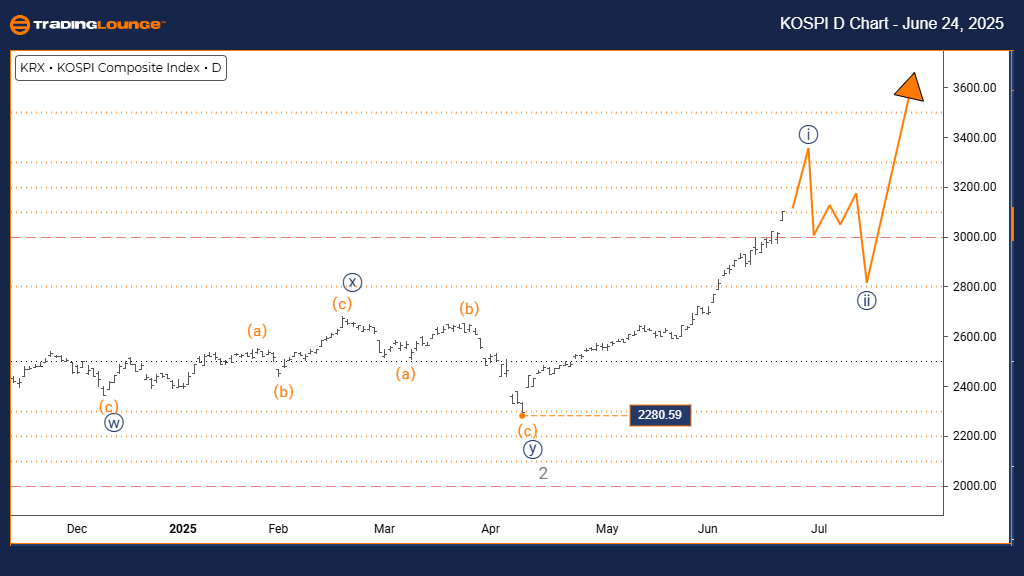
KOSPI Composite Elliott Wave Forecast – Trading Lounge Daily Chart

KOSPI Elliott Wave Technical Analysis

FUNCTION: Bullish Momentum

MODE: Impulsive Structure

STRUCTURE: Navy Blue Wave 1

POSITION: Gray Wave 3

DIRECTION NEXT LOWER DEGREES: Navy Blue Wave 2

DETAILS:
The corrective Gray Wave 2 looks complete. Now initiating is Navy Blue Wave 1 of 3.
Invalidation Level: 2280.59

Daily Elliott Wave analysis of the KOSPI Composite Index indicates a bullish structure. The price is advancing impulsively, signaling strong buyer activity. Currently, Navy Blue Wave 1 is unfolding within a larger Gray Wave 3 movement.

The shift from Gray Wave 2 to Navy Blue Wave 1 suggests a renewed upward leg in the Elliott Wave sequence. The anticipated next move is Navy Blue Wave 2, typically a short-term retracement that follows an initial push.

Monitor the 2280.59 level closely—any drop below this would invalidate the wave count. If the support holds, the pattern implies ongoing bullish action.

Overall, technical indicators show that KOSPI may continue its uptrend. The impulsive structure adds weight to a positive outlook as Gray Wave 3 evolves.

KOSPI-d-index-chart-...


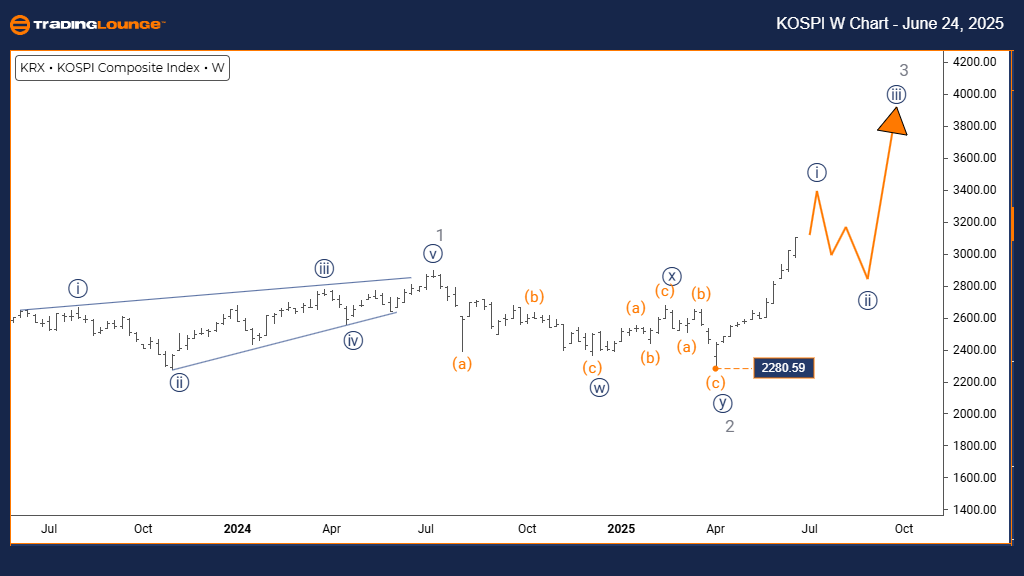
KOSPI Composite Elliott Wave Forecast – Trading Lounge Weekly Chart

KOSPI Elliott Wave Technical Analysis

FUNCTION: Bullish Momentum

MODE: Impulsive Structure

STRUCTURE: Navy Blue Wave 1

POSITION: Gray Wave 3

DIRECTION NEXT LOWER DEGREES: Navy Blue Wave 2

DETAILS:
Gray Wave 2 seems to have concluded. Navy Blue Wave 1 of 3 is gaining ground.
Invalidation Level: 2280.59

The weekly Elliott Wave chart for the KOSPI Composite reaffirms the ongoing bullish trend. The impulsive setup continues with Navy Blue Wave 1 progressing inside Gray Wave 3—an early stage of a potential long-term rally.

Completion of Gray Wave 2 sets the stage for a strong Navy Blue Wave 1 advance. After this wave finishes, expect a corrective Navy Blue Wave 2.

Key support at 2280.59 must hold. If breached, the wave count will need to be reassessed. Otherwise, continued upward action is anticipated under this bullish framework.

This Elliott Wave structure supports further upside for the KOSPI Index. Sustained investor interest and technical momentum suggest the index may climb further in the coming weeks and months.

Technical Analyst: Malik Awais

Source: Visit Tradinglounge.com and learn from the Experts. Join TradingLounge Here

Previous: RUSSELL 2000 Index Elliott Wave Technical Analysis

VALUE Offer - Buy 1 Month & Get 3 Months!Click here

Access 7 Analysts Over 200 Markets Covered. Chat Room With Support

KOSPI-w-index-chart-...

Related

Euro/British Pound(EURGBP) 4 Hour Chart Elliott Wave Technical Analysis 15 November 23

Euro/British Pound(EURGBP) 4 Hour Chart Elliott Wave Technical Analysis 15 November 23

Euro/British Pound(EURGBP) 4 Hour Chart Elliott Wave Technical Analysis 15 November 23 offers an in-...

Read More >
Elliott Wave Analysis for Dogecoin (DOGEUSD): Short-Term Price Forecast, Trade Strategy, Wave 3 Setup & Resistance Insights

Elliott Wave Analysis for Dogecoin (DOGEUSD): Short-Term Price Forecast, Trade Strategy, Wave 3 Setup & Resistance Insights

Elliott Wave analysis for Dogecoin (DOGEUSD), detailing the current impulsive wave structure, predic...

Read More >
BTCUSD Elliott Wave Analysis: Bitcoin Price Prediction, Trading Strategy, Support & Resistance Levels, and Crypto Market Trends

BTCUSD Elliott Wave Analysis: Bitcoin Price Prediction, Trading Strategy, Support & Resistance Levels, and Crypto Market Trends

Bitcoin Elliott Wave Forecast with detailed BTCUSD price analysis. Our BTC/USD trading strategy expl...

Read More >
U.S.Dollar /Canadian Dollar(USD/CAD) Elliott Wave Technical Analysis 17 November 23

U.S.Dollar /Canadian Dollar(USD/CAD) Elliott Wave Technical Analysis 17 November 23

U.S.Dollar /Canadian Dollar(USD/CAD) Elliott Wave Technical Analysis 17 November 23, provides a comp...

Read More >
S&P/TSX 60 Index Elliott Wave Technical Analysis Shows Reinforcing the overall Bullish Outlook in both Daily and Weekly Charts

S&P/TSX 60 Index Elliott Wave Technical Analysis Shows Reinforcing the overall Bullish Outlook in both Daily and Weekly Charts

The S&P/TSX 60 is in a bullish trend, according to Elliott Wave analysis. Gray wave 2 of orange wave...

Read More >

$1 for 2 Weeks

then $29 a month!

What a Special Offer!

Trade Recommendations

Unleash the power of deversified trading with our comprehensive portfolio, covering 250+ markets:

  • Stock Trades
  • Crypto Trades
  • Forex Trades
  • Commodity Trades
Elliott Wave Analysis

Gain a competitive edge with expert insights and AI-powered Elliott Wave charting into:

  • Global Indices
  • US Stocks & ASX Stocks
  • Forex & Crypto
  • Commodities
Top-Notch Trading Tools

Equip yourself with the tools of success:

  • Real-time Chat rooms
  • Elliott Wave Algorithm
  • Portfolio tools
  • TradingLevels
  • Screener
  • Trading Game
7 Elliott Wave Analysts

Stay ahead of the market with daily charts and insightful videos
Your secret to strategic trading!

JOIN HERE


Welcome to TradingLounge (ASIC A.R.No. 321187), specialists in trades, trading education and technical analysis, covering stocks, indices, commodities, forex and cryptocurrencies.

When you join TradingLounge you have access to everything we offer, including trade tools, educational content and a social platform to chat with like-minded investors.

Read more

@Copyright 2024 by tradinglounge.com

Contact Us

Australian no: 02 4787 6020

International no: +61 (2) 47876020

Pay with:

Find us on