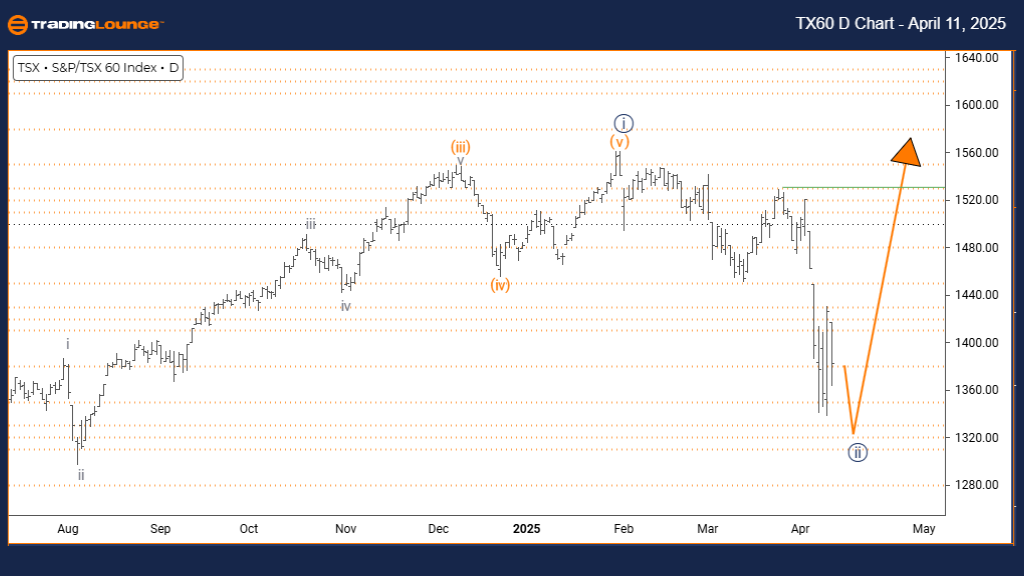
S&P/TSX 60 Elliott Wave Analysis – Trading Lounge Day Chart
S&P/TSX 60 Elliott Wave Technical Analysis
Function: Counter Trend
Mode: Corrective
Structure: Navy blue wave 2
Position: Gray wave 3
Direction (Next Higher Degrees): Navy blue wave 3
Details: Completion of navy blue wave 1 observed; navy blue wave 2 is unfolding.
The daily Elliott Wave analysis of the S&P/TSX 60 index reveals the market is in a counter-trend correction phase. The structure under observation is navy blue wave 2, which forms a segment of the broader gray wave 3 impulsive cycle.
The prior navy blue wave 1 has likely ended, and the index is navigating through wave 2. The expected progression is an upward breakout into wave 3, typically known for sustained bullish momentum and alignment with the broader uptrend.
This market configuration signals a bullish continuation pattern after the wave 2 correction is complete. Traders should monitor standard Elliott Wave corrective formations—including zigzags, flats, and triangles—to identify when the wave 2 structure finalizes. Confirming the transition from corrective to impulsive phase is essential for validating the wave count.
Using volume and momentum indicators can help confirm the beginning of wave 3, often regarded as the most forceful segment in Elliott Wave progression. This ongoing corrective stage could provide a strategic setup for traders preparing for a possible upside breakout.
The Elliott Wave framework remains a reliable approach to forecasting price action. Staying attuned to wave sequences and combining them with technical indicators ensures alignment with market trends. A breakout within navy blue wave 3 could signify a strong upward trajectory for the S&P/TSX 60.
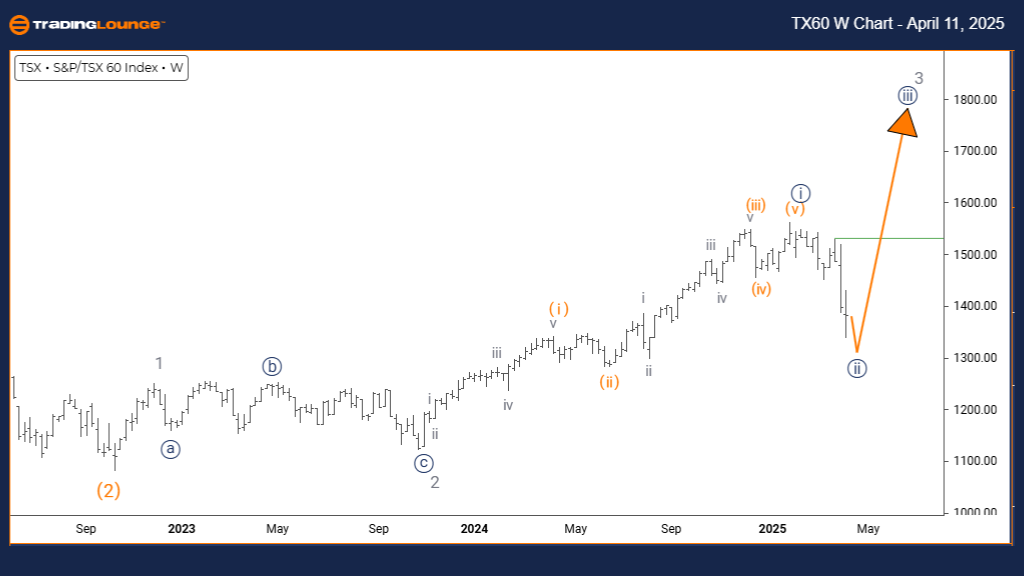
S&P/TSX 60 Elliott Wave Analysis – Trading Lounge Weekly Chart
S&P/TSX 60 Elliott Wave Technical Analysis
Function: Counter Trend
Mode: Corrective
Structure: Navy blue wave 2
Position: Gray wave 3
Direction (Next Higher Degrees): Navy blue wave 3
Details: Navy blue wave 1 appears completed; navy blue wave 2 is currently forming.
On the weekly timeframe, Elliott Wave analysis of the S&P/TSX 60 index identifies a counter-trend corrective phase in development. The structure confirms completion of navy blue wave 1, and the market is now progressing within navy blue wave 2, as part of a larger gray wave 3 uptrend.
Wave 2 generally retraces part of the gain from wave 1. The current correction is expected to follow common Elliott Wave patterns such as zigzags, flats, or triangles before shifting into wave 3, known for high momentum and strong market direction.
Traders should closely observe the end of wave 2, which could lead into a robust bullish trend under wave 3. Identifying the shift from corrective to impulsive behavior is key to capturing entry points. Supporting indicators—such as changes in volume and momentum—can help confirm this transition.
This corrective move appears to be a short-term pullback in the context of a long-term bullish trend. Once wave 2 concludes, the index may resume upward movement under wave 3, offering substantial trading opportunities.
From a weekly perspective, this setup fits into the broader Elliott Wave cycle, creating a meaningful foundation for the next impulsive leg. Traders should stay focused on wave structure and technical confirmations to optimally time market entries.
Technical Analyst: Malik Awais
Source: Visit Tradinglounge.com and learn from the Experts Join TradingLounge Here
Previous: CAC 40 (France) Elliott Wave Technical Analysis
VALUE Offer - Buy 1 Month & Get 3 Months!Click here
Access 7 Analysts Over 200 Markets Covered. Chat Room With Support