Gold (XAUUSD) Elliott Wave Technical Analysis
Gold's recent pullback appears complete, setting the stage for a renewed bullish trend that may push the price toward a new all-time high. Based on Elliott Wave theory, Gold is projected to advance to 2800 or higher before the next correction initiates.
Gold (XAUUSD) Commodity Daily Chart Analysis
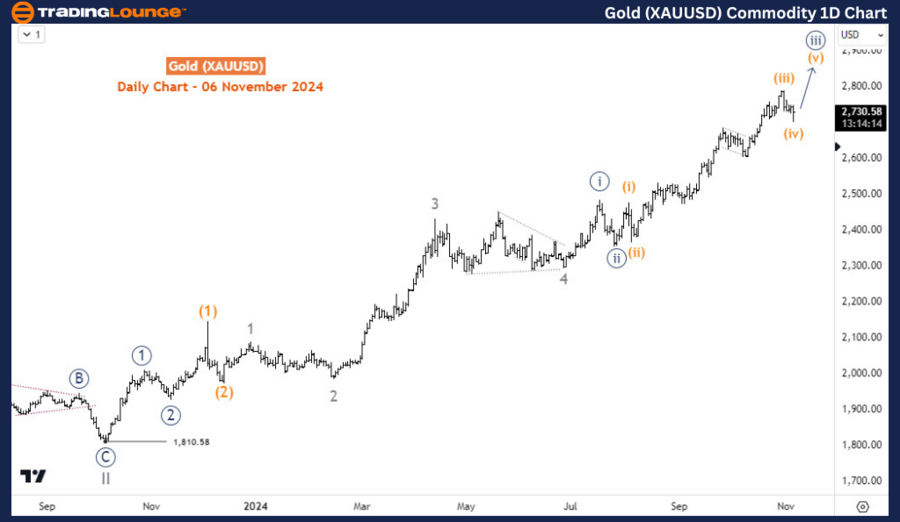
On the daily chart, Gold completed its cycle degree wave II in October 2023, bottoming at 1810. Since then, the current bullish phase is rooted in this key date. Presently, the price is progressing through wave ((iii)) of 5 of (3) of ((3)) of III, suggesting Gold could still experience a 30-50% surge from the current levels. This setup signals a favourable buying opportunity on pullbacks for traders aiming to capture further gains.

Gold (XAUUSD) Commodity H4 Chart Analysis
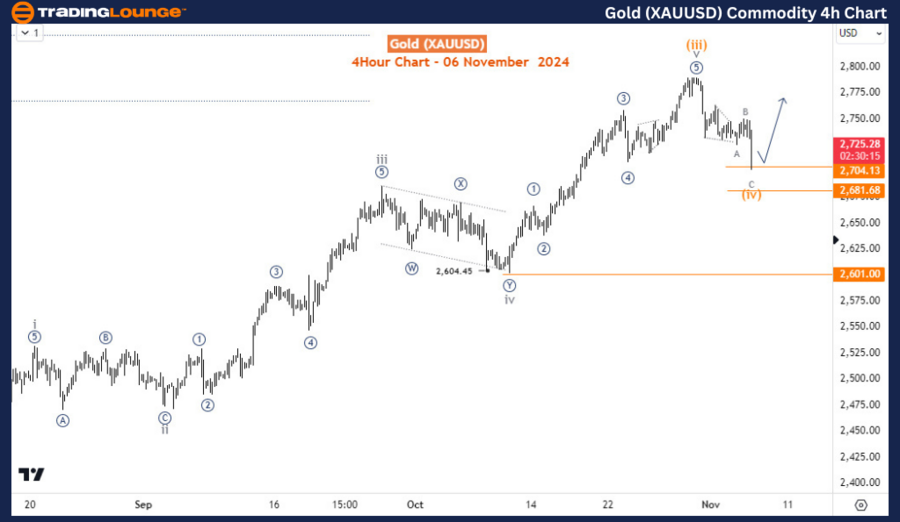
On the H4 chart, Gold is in wave (iv) of ((iii)), which may have concluded. However, there is potential for a double zigzag correction if the current bounce from 2701 shows corrective characteristics. With the initial zigzag structure complete, upcoming price action will clarify if a recovery towards wave (v) of ((iii)) unfolds or if wave (iv) dips further in a double zigzag. Regardless, the overall outlook remains bullish, with Gold likely to resume its uptrend to complete wave ((iii)) before another pullback in wave ((iv)) occurs.
Technical Analyst: Sanmi Adeagbo
Source: visit Tradinglounge.com and learn From the Experts Join TradingLounge Here
See Previous: Iron Ore Index Elliott Wave Technical Analysis
VALUE Offer - Buy 1 Month & Get 3 Months!Click here
Access 7 Analysts Over 200 Markets Covered. Chat Room With Support
