08Jul

The Walt Disney Co. (DIS) U.S. Stocks Elliott Wave Technical Analysis : DIS Approaching Wave (5) of C at $128 Resistance

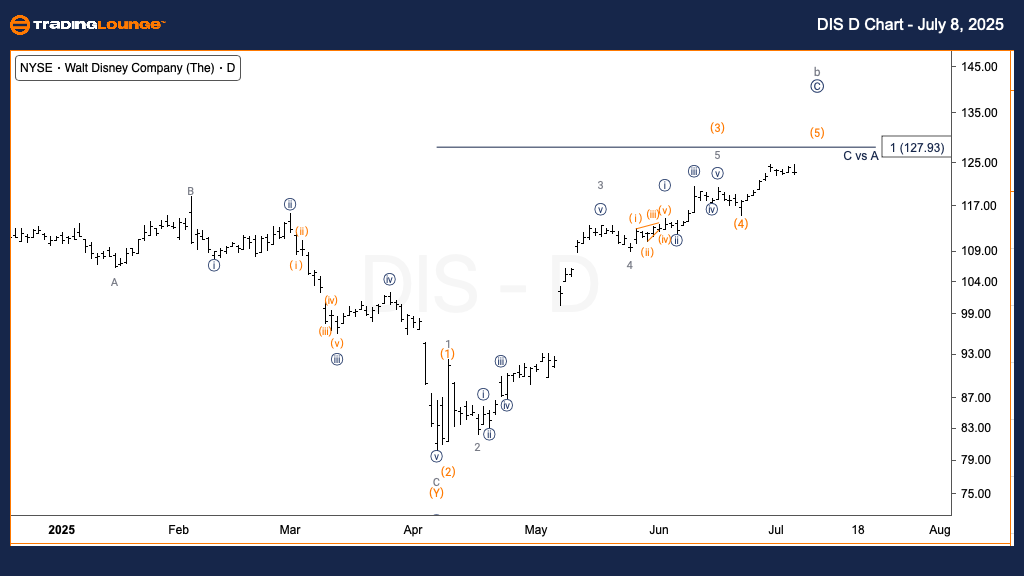
The Walt Disney Co. (DIS) Elliott Wave Analysis - TradingLounge Daily Chart

The Walt Disney Co. (DIS) Daily Chart Analysis

DIS Elliott Wave Technical Analysis

FUNCTION: Trend

MODE: Impulsive

STRUCTURE: Motive

POSITION: Wave (5) of C

DIRECTION: Top in Wave (5)

DETAILS:
The upward trend that started on April 7 is showing signs of peaking. The projected target for Primary Wave C aligns with Wave A around the $128 price level.

On the daily chart, The Walt Disney Co. (DIS) is approaching the end of a corrective rally, currently forming wave (5) of C. This leg of the rally is structured as a motive wave, stemming from the April 7 low. As wave C converges with the height of wave A near $128, traders should watch this resistance zone closely. If wave (5) completes in this range, it could indicate the conclusion of the corrective cycle and the beginning of a potential market reversal.

DIS-D-Chart-080725


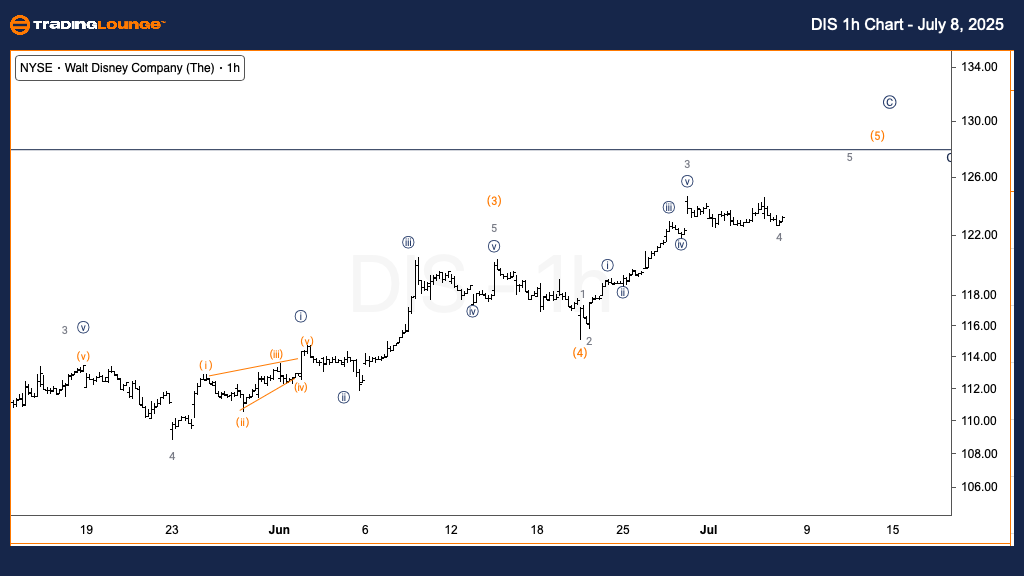
The Walt Disney Co. (DIS) Elliott Wave Analysis - TradingLounge 1H Chart

The Walt Disney Co. DIS Elliott Wave Technical Analysis

FUNCTION: Trend

MODE: Impulsive

STRUCTURE: Motive

POSITION: Wave 4 of (5)

DIRECTION: Upside in Wave 5

DETAILS:

Wave 4 of (5) is currently forming, and another upward movement is expected into wave 5 of (5).
There is also a bullish scenario in which this structure could evolve into wave 1 and 2 of a new upward impulsive sequence.

The 1-hour timeframe for DIS signals that wave 4 of (5) is nearly complete. A final advance into wave 5 of (5) is projected to complete the overall corrective structure of wave C. Alternatively, a bullish wave count suggests the current formation might be the early phase of a new impulsive trend. Should this alternate scenario materialize, DIS stock could surpass present levels, targeting resistance above the $128 mark.

Technical Analyst: Alessio Barretta

Visit: TradingLounge.com for detailed analysis and market updates.

Previous: Mastercard Inc. (MA) Elliott Wave Technical Analysis

VALUE Offer - $1 for 2 Weeks then $29 a month!Click here

Access 7 Analysts Over 200 Markets Covered. Chat Room With Support

DIS-1h-Chart-080725

Related

BLOCK INC (SQ2) ASX Elliott Wave Analysis: Stock Forecast, Breakout Targets, Invalidation Points, and Trading Strategies for Investors

BLOCK INC (SQ2) ASX Elliott Wave Analysis: Stock Forecast, Breakout Targets, Invalidation Points, and Trading Strategies for Investors

This analysis covers BLOCK INC (SQ2) Elliott Wave technical patterns, highlighting breakout targets,...

Read More >
Utilizing Elliott Wave theory On TASI Index Stock Market Analysis: TASI Index Elliott Wave Technical Analysis

Utilizing Elliott Wave theory On TASI Index Stock Market Analysis: TASI Index Elliott Wave Technical Analysis

Our detailed TASI Index Elliott Wave analysis provides insights into market trends, wave structure, ...

Read More >
DOTUSD Elliott Wave Analysis: Polkadot Price Prediction, Trading Strategy, Market Trends, Support and Resistance Levels Insights

DOTUSD Elliott Wave Analysis: Polkadot Price Prediction, Trading Strategy, Market Trends, Support and Resistance Levels Insights

DOTUSD Elliott Wave analysis offers valuable insights into Polkadot's price prediction, trading ...

Read More >
Stock Market Analysis: Elliott Wave Insights & Strategies NASDAQ, AAPL, AMZN, NVDA, TSLA, GOOGL, META, NFLX, MSFT (VIDEO)

Stock Market Analysis: Elliott Wave Insights & Strategies NASDAQ, AAPL, AMZN, NVDA, TSLA, GOOGL, META, NFLX, MSFT (VIDEO)

Stock market analysis and trading strategies: NASDAQ, Apple (AAPL),Tesla (TSLA), Amazon (AMZN), Nvid...

Read More >
NIFTY 50 INDEX Elliott Wave Technical Analysis: Indian Stock Market Outlook Progressing Toward the 25,000-25,100 Range

NIFTY 50 INDEX Elliott Wave Technical Analysis: Indian Stock Market Outlook Progressing Toward the 25,000-25,100 Range

The NIFTY 50 Index is currently in a corrective wave pattern, progressing toward the 25,000-25,100 r...

Read More >
Gold (XAUUSD) Elliott Wave Technical Analysis

Gold (XAUUSD) Elliott Wave Technical Analysis

Stay ahead in the Gold (XAUUSD) market with our Elliott Wave Technical Analysis for February 14, 202...

Read More >

$1 for 2 Weeks

then $29 a month!

What a Special Offer!

Trade Recommendations

Unleash the power of deversified trading with our comprehensive portfolio, covering 250+ markets:

  • Stock Trades
  • Crypto Trades
  • Forex Trades
  • Commodity Trades
Elliott Wave Analysis

Gain a competitive edge with expert insights and AI-powered Elliott Wave charting into:

  • Global Indices
  • US Stocks & ASX Stocks
  • Forex & Crypto
  • Commodities
Top-Notch Trading Tools

Equip yourself with the tools of success:

  • Real-time Chat rooms
  • Elliott Wave Algorithm
  • Portfolio tools
  • TradingLevels
  • Screener
  • Trading Game
7 Elliott Wave Analysts

Stay ahead of the market with daily charts and insightful videos
Your secret to strategic trading!

JOIN HERE


Welcome to TradingLounge (ASIC A.R.No. 321187), specialists in trades, trading education and technical analysis, covering stocks, indices, commodities, forex and cryptocurrencies.

When you join TradingLounge you have access to everything we offer, including trade tools, educational content and a social platform to chat with like-minded investors.

Read more

@Copyright 2024 by tradinglounge.com

Contact Us

Australian no: 02 4787 6020

International no: +61 (2) 47876020

Pay with:

Find us on