02Apr

Elliott Wave XLE SPDR Energy Select Sector ETF Analysis Reveals Bullish Energy ETF Forecast and Key Trading Strategy for 2025 Investors

XLE – SPDR Energy Select Sector ETF | Elliott Wave Analysis

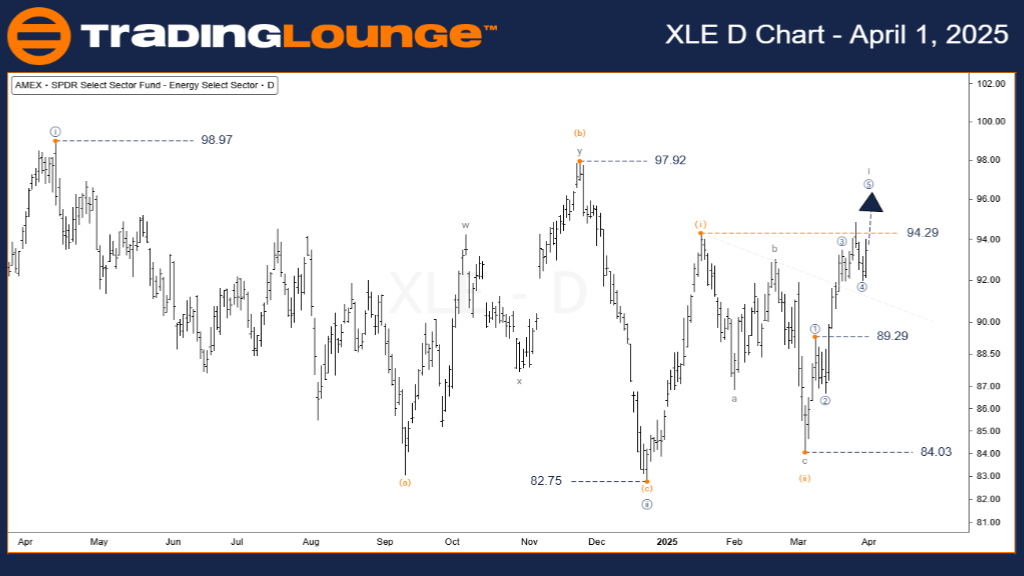
XLE – SPDR Energy Daily Chart Overview (1D)

XLE – SPDR Energy ETF Elliott Wave Analysis

Function: Major Trend

Mode: Motive

Structure: Impulse Wave

Current Position: Wave i of (iii)

Direction: Uptrend

Invalidation Level: $84.03

Details: The current Elliott Wave pattern on the daily chart of XLE indicates an early-stage rally in wave (iii), with wave i nearing its completion.

A corrective move in wave ii is projected next, potentially providing a favorable buying setup for long-term investors.
The key bullish phase—wave iii of (iii)—has not yet begun, highlighting XLE as a top candidate for active monitoring among energy ETFs.

XLE-SPDR-Energy-1D-0...

XLE – SPDR Energy Select Sector ETF Elliott Wave Analysis

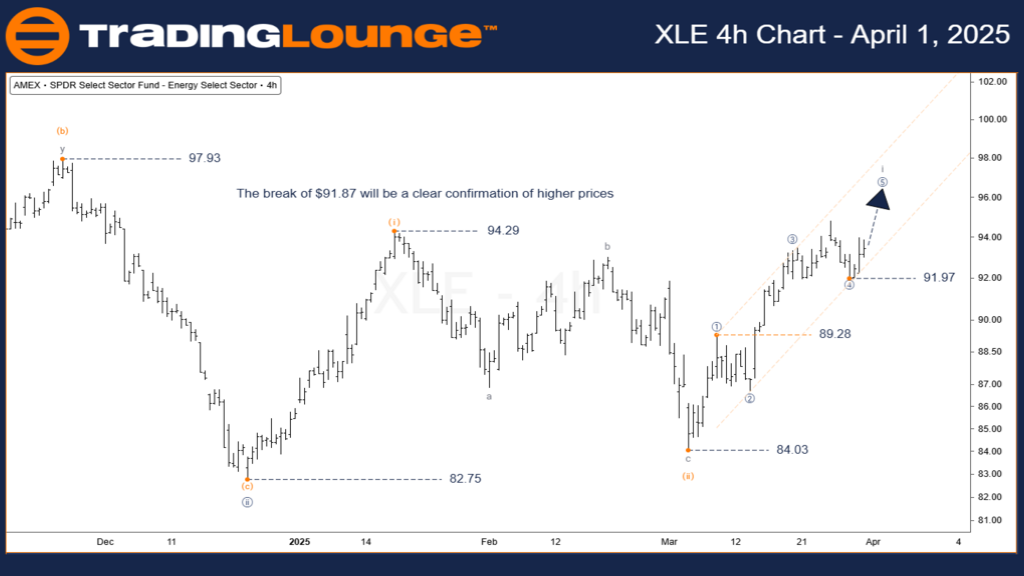
XLE – SPDR Energy 4-Hour Chart Overview (4H)

Function: Major Trend

Mode: Motive

Structure: Impulse

Current Position: Wave [5] of i

Direction: Uptrend

Invalidation Level: $91.97

Details: On the 4-hour timeframe, XLE is progressing through wave [5], targeting the final stage of wave i in the broader bullish impulse.

This movement could offer a tactical opportunity for intraday or short-term traders looking for entry within an established uptrend.
Price action suggests that the $94.29 resistance is likely to be breached as wave [5] develops further.

Technical Analyst: Siinom

Source: Visit Tradinglounge.com and learn from the Experts. Join TradingLounge Here 

See Previous:  Energy Select Sector ETF (XLE) Elliott Wave Technical Analysis

VALUE Offer - Buy 1 Month & Get 3 Months!Click here

Access 7 Analysts Over 200 Markets Covered. Chat Room With Support

XLE-SPDR-Energy-4h-0...

Conclusion
Wave i is approaching completion, and the upcoming wave ii correction could present a strategic long-entry opportunity.
Resistance is projected near the $96.00 level, marking a potential ceiling for the current leg up.
Traders focused on energy sector ETFs should closely monitor XLE for long setups during this anticipated pullback.
Adherence to Elliott Wave principles and vigilant observation of invalidation levels remain essential for risk control.

Related

Elliott Wave Insights: Major Indices & Exclusive Offer

Elliott Wave Insights: Major Indices & Exclusive Offer

This blog post offers an in-depth Elliott Wave analysis for major indices including the S&P 500, NAS...

Read More >
Dogecoin Crypto Price News Today Elliott Wave Technical Analysis: Perfect for Crypto Traders and Investors

Dogecoin Crypto Price News Today Elliott Wave Technical Analysis: Perfect for Crypto Traders and Investors

Gain insights into Dogecoin's market trends with our detailed DOGEUSD Elliott Wave analysis. Thi...

Read More >
Valuable Insights And Stock's Performance: Chevron Inc. (CVX) Stocks Elliott Wave Technical Analysis

Valuable Insights And Stock's Performance: Chevron Inc. (CVX) Stocks Elliott Wave Technical Analysis

This comprehensive analysis of Chevron Inc. (CVX) provides valuable insights into the stock's pe...

Read More >
Unlocking ASX Trading Success: BLOCK INC. - SQ2 Stock Analysis & Elliott Wave Technical Forecast

Unlocking ASX Trading Success: BLOCK INC. - SQ2 Stock Analysis & Elliott Wave Technical Forecast

This article provides an expert Elliott Wave analysis of BLOCK INC. - SQ2 on the Australian Stock Ex...

Read More >
Natural Gas Commodity Elliott Technical Analysis: Strategic Trading Opportunities to help you Navigate the Market Effectively

Natural Gas Commodity Elliott Technical Analysis: Strategic Trading Opportunities to help you Navigate the Market Effectively

Explore our detailed natural gas technical analysis through Elliott Wave theory. Learn about the cur...

Read More >
New Zealand Dollar/U.S. Dollar (NZDUSD) Elliott Wave Technical Analysis: 4-Hour & Daily Chart Overview, February 13, 2024

New Zealand Dollar/U.S. Dollar (NZDUSD) Elliott Wave Technical Analysis: 4-Hour & Daily Chart Overview, February 13, 2024

Expert insights into NZDUSD analysis and forecasts, covering the New Zealand Dollar/U.S. Dollar curr...

Read More >

$1 for 2 Weeks

then $29 a month!

What a Special Offer!

Trade Recommendations

Unleash the power of deversified trading with our comprehensive portfolio, covering 250+ markets:

  • Stock Trades
  • Crypto Trades
  • Forex Trades
  • Commodity Trades
Elliott Wave Analysis

Gain a competitive edge with expert insights and AI-powered Elliott Wave charting into:

  • Global Indices
  • US Stocks & ASX Stocks
  • Forex & Crypto
  • Commodities
Top-Notch Trading Tools

Equip yourself with the tools of success:

  • Real-time Chat rooms
  • Elliott Wave Algorithm
  • Portfolio tools
  • TradingLevels
  • Screener
  • Trading Game
7 Elliott Wave Analysts

Stay ahead of the market with daily charts and insightful videos
Your secret to strategic trading!

JOIN HERE


Welcome to TradingLounge (ASIC A.R.No. 321187), specialists in trades, trading education and technical analysis, covering stocks, indices, commodities, forex and cryptocurrencies.

When you join TradingLounge you have access to everything we offer, including trade tools, educational content and a social platform to chat with like-minded investors.

Read more

@Copyright 2024 by tradinglounge.com

Contact Us

Australian no: 02 4787 6020

International no: +61 (2) 47876020

Pay with:

Find us on