23Jun

AXIS BANK Elliott Wave Forecast Shows Bullish Trend With Wave 5 Impulse and Key ₹932 Level in Price Action Outlook

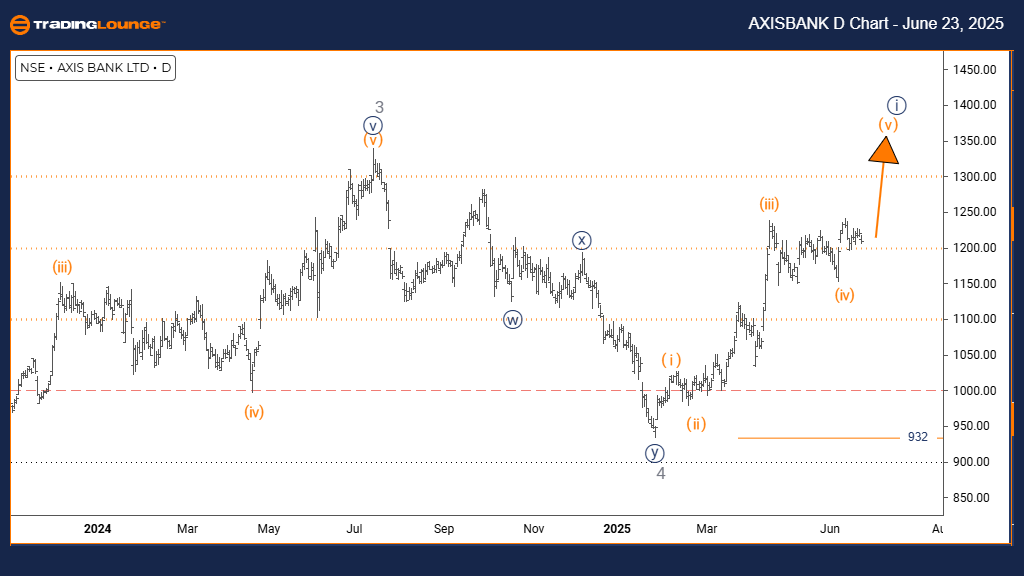
AXIS BANK Elliott Wave Analysis – Trading Lounge Daily Chart

AXIS BANK Indian Stock Daily Chart

AXIS BANK Elliott Wave Technical Analysis

FUNCTION: Bullish Trend

MODE: Impulsive

STRUCTURE: Orange Wave 5

POSITION: Navy Blue Wave 1

DIRECTION NEXT LOWER DEGREES: Navy Blue Wave 2

DETAILS: Orange Wave 4 is likely completed; Orange Wave 5 appears in progress.

CANCEL INVALID LEVEL: 932

The AXIS BANK daily chart presents a clear bullish structure through Elliott Wave analysis. Current price movement is classified as impulsive, indicating solid upward momentum. The active wave, Orange Wave 5, is part of the broader Navy Blue Wave 1, suggesting this marks the concluding stage of the primary impulse within an ongoing uptrend.

Technical readings point to a completed Orange Wave 4 corrective phase. Development of Orange Wave 5 has started, typically characterized by sharp price increases. Following this wave, a correction—Navy Blue Wave 2—is anticipated, aligning with Elliott Wave theory.

The 932 level serves as a critical invalidation point. A price drop beneath this would call for a revision of the current wave count and reevaluation of the bullish scenario. Above this level, the structure remains intact, projecting further gains.

In summary, AXIS BANK appears in the final phase of an impulsive wave sequence, with strong bullish momentum underpinning Orange Wave 5. While the trend remains positive, traders should stay cautious as the completion of Navy Blue Wave 1 nears.

AXIS-BANK-Indian-Sto...


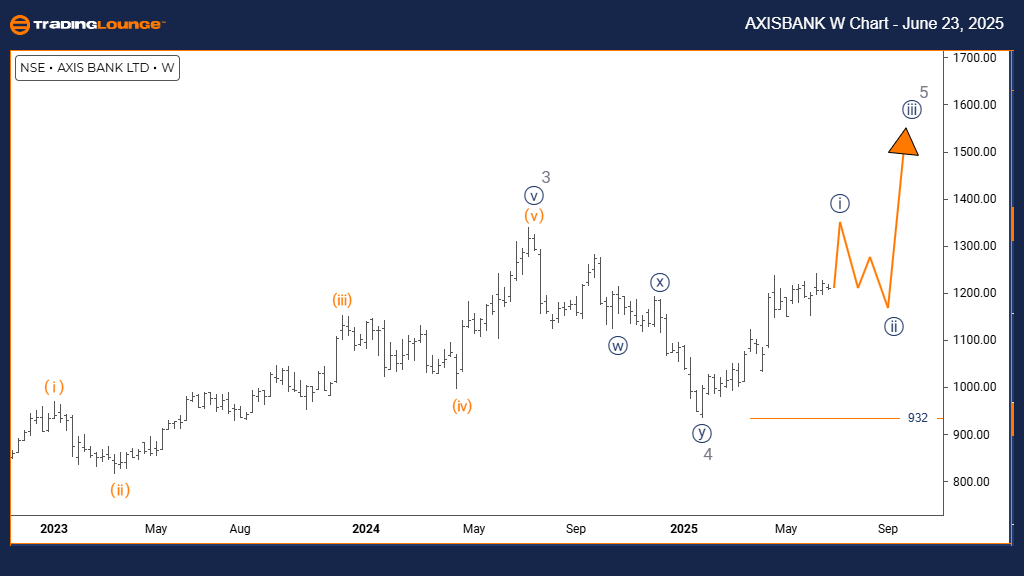
AXIS BANK Elliott Wave Analysis – Trading Lounge Weekly Chart

AXIS BANK Elliott Wave Technical Analysis

FUNCTION: Bullish Trend

MODE: Impulsive

STRUCTURE: Navy Blue Wave 1

POSITION: Gray Wave 5

DIRECTION NEXT LOWER DEGREES: Navy Blue Wave 2

DETAILS: Gray Wave 4 appears completed; Navy Blue Wave 1 is currently forming.

CANCEL INVALID LEVEL: 932

The AXIS BANK weekly chart maintains a bullish Elliott Wave pattern. The market is showing impulsive behavior, consistent with a strong trend. This phase is labeled Navy Blue Wave 1, which fits within the broader Gray Wave 5. This suggests a developing final wave in the long-term bullish setup.

Following the conclusion of Gray Wave 4, Navy Blue Wave 1 has emerged, initiating the final upward movement. This wave often indicates strong momentum and sets the stage for future corrections, notably Navy Blue Wave 2, expected once Wave 1 ends.

The 932 level remains a critical pivot. A decline below this would invalidate the current Elliott count and weaken the bullish projection. So long as the price stays above it, the technical outlook continues to favor the upside.

Overall, AXIS BANK is in a favorable position with the first segment of the final bullish wave active. The impulsive nature of Navy Blue Wave 1 supports continued buying pressure. Still, traders should remain alert to signals of a potential trend reversal as the pattern unfolds.

Technical Analyst: Malik Awais

Source: Visit Tradinglounge.com and learn from the Experts. Join TradingLounge Here

Previous: KOTAK BANK Elliott Wave Technical Analysis

VALUE Offer - $1 for 2 Weeks then $29 a month!Click here

Access 7 Analysts Over 200 Markets Covered. Chat Room With Support

AXIS-BANK-Indian-Sto...

Related

Showcasing Bullish Trend Insights and Forecast - U.S. Dollar / Japanese Yen (USDJPY) Forex Elliott Wave Technical Analysis

Showcasing Bullish Trend Insights and Forecast - U.S. Dollar / Japanese Yen (USDJPY) Forex Elliott Wave Technical Analysis

This article provides an in-depth USDJPY Elliott Wave analysis, showcasing bullish trends and key wa...

Read More >
Bitcoin/U.S. dollar(BTCUSD) Elliott Wave Technical Analysis 31 October 23

Bitcoin/U.S. dollar(BTCUSD) Elliott Wave Technical Analysis 31 October 23

Bitcoin/U.S. dollar(BTCUSD) Elliott Wave Technical Analysis on 31 October 23 with BTCUSD Analysis Da...

Read More >
Elliott Wave Trading Strategies: SP500, NASDAQ 100, Tech Stocks, and Bitcoin

Elliott Wave Trading Strategies: SP500, NASDAQ 100, Tech Stocks, and Bitcoin

Stay updated with TradingLounge’s latest Elliott Wave trading strategies for SP500, NASDAQ 100, lea...

Read More >
VeChain Elliott Wave Analysis Signals Possible Wave III Breakout from Support: VETUSD Trading Strategy for Crypto Traders

VeChain Elliott Wave Analysis Signals Possible Wave III Breakout from Support: VETUSD Trading Strategy for Crypto Traders

The VETUSD pair is nearing the end of Wave II in a corrective structure. A bounce from the 0.020–0....

Read More >
U.S.Dollar/Japanese Yen(USDJPY) Forex Elliott Wave Technical Analysis: Impulsive Trends and Key Levels to Watch

U.S.Dollar/Japanese Yen(USDJPY) Forex Elliott Wave Technical Analysis: Impulsive Trends and Key Levels to Watch

Elliott Wave analysis of the USDJPY currency pair highlights the current trend, explains the impulsi...

Read More >
WTI Crude Oil Forecast and Elliott Wave Technical Analysis - Market Trends and Trading Strategies

WTI Crude Oil Forecast and Elliott Wave Technical Analysis - Market Trends and Trading Strategies

Explore in-depth Elliott Wave analysis of WTI crude oil, including current market trends, price pred...

Read More >

$1 for 2 Weeks

then $29 a month!

What a Special Offer!

Trade Recommendations

Unleash the power of deversified trading with our comprehensive portfolio, covering 250+ markets:

  • Stock Trades
  • Crypto Trades
  • Forex Trades
  • Commodity Trades
Elliott Wave Analysis

Gain a competitive edge with expert insights and AI-powered Elliott Wave charting into:

  • Global Indices
  • US Stocks & ASX Stocks
  • Forex & Crypto
  • Commodities
Top-Notch Trading Tools

Equip yourself with the tools of success:

  • Real-time Chat rooms
  • Elliott Wave Algorithm
  • Portfolio tools
  • TradingLevels
  • Screener
  • Trading Game
7 Elliott Wave Analysts

Stay ahead of the market with daily charts and insightful videos
Your secret to strategic trading!

JOIN HERE


Welcome to TradingLounge (ASIC A.R.No. 321187), specialists in trades, trading education and technical analysis, covering stocks, indices, commodities, forex and cryptocurrencies.

When you join TradingLounge you have access to everything we offer, including trade tools, educational content and a social platform to chat with like-minded investors.

Read more

@Copyright 2024 by tradinglounge.com

Contact Us

Australian no: 02 4787 6020

International no: +61 (2) 47876020

Pay with:

Find us on